QUESTION IMAGE
Question
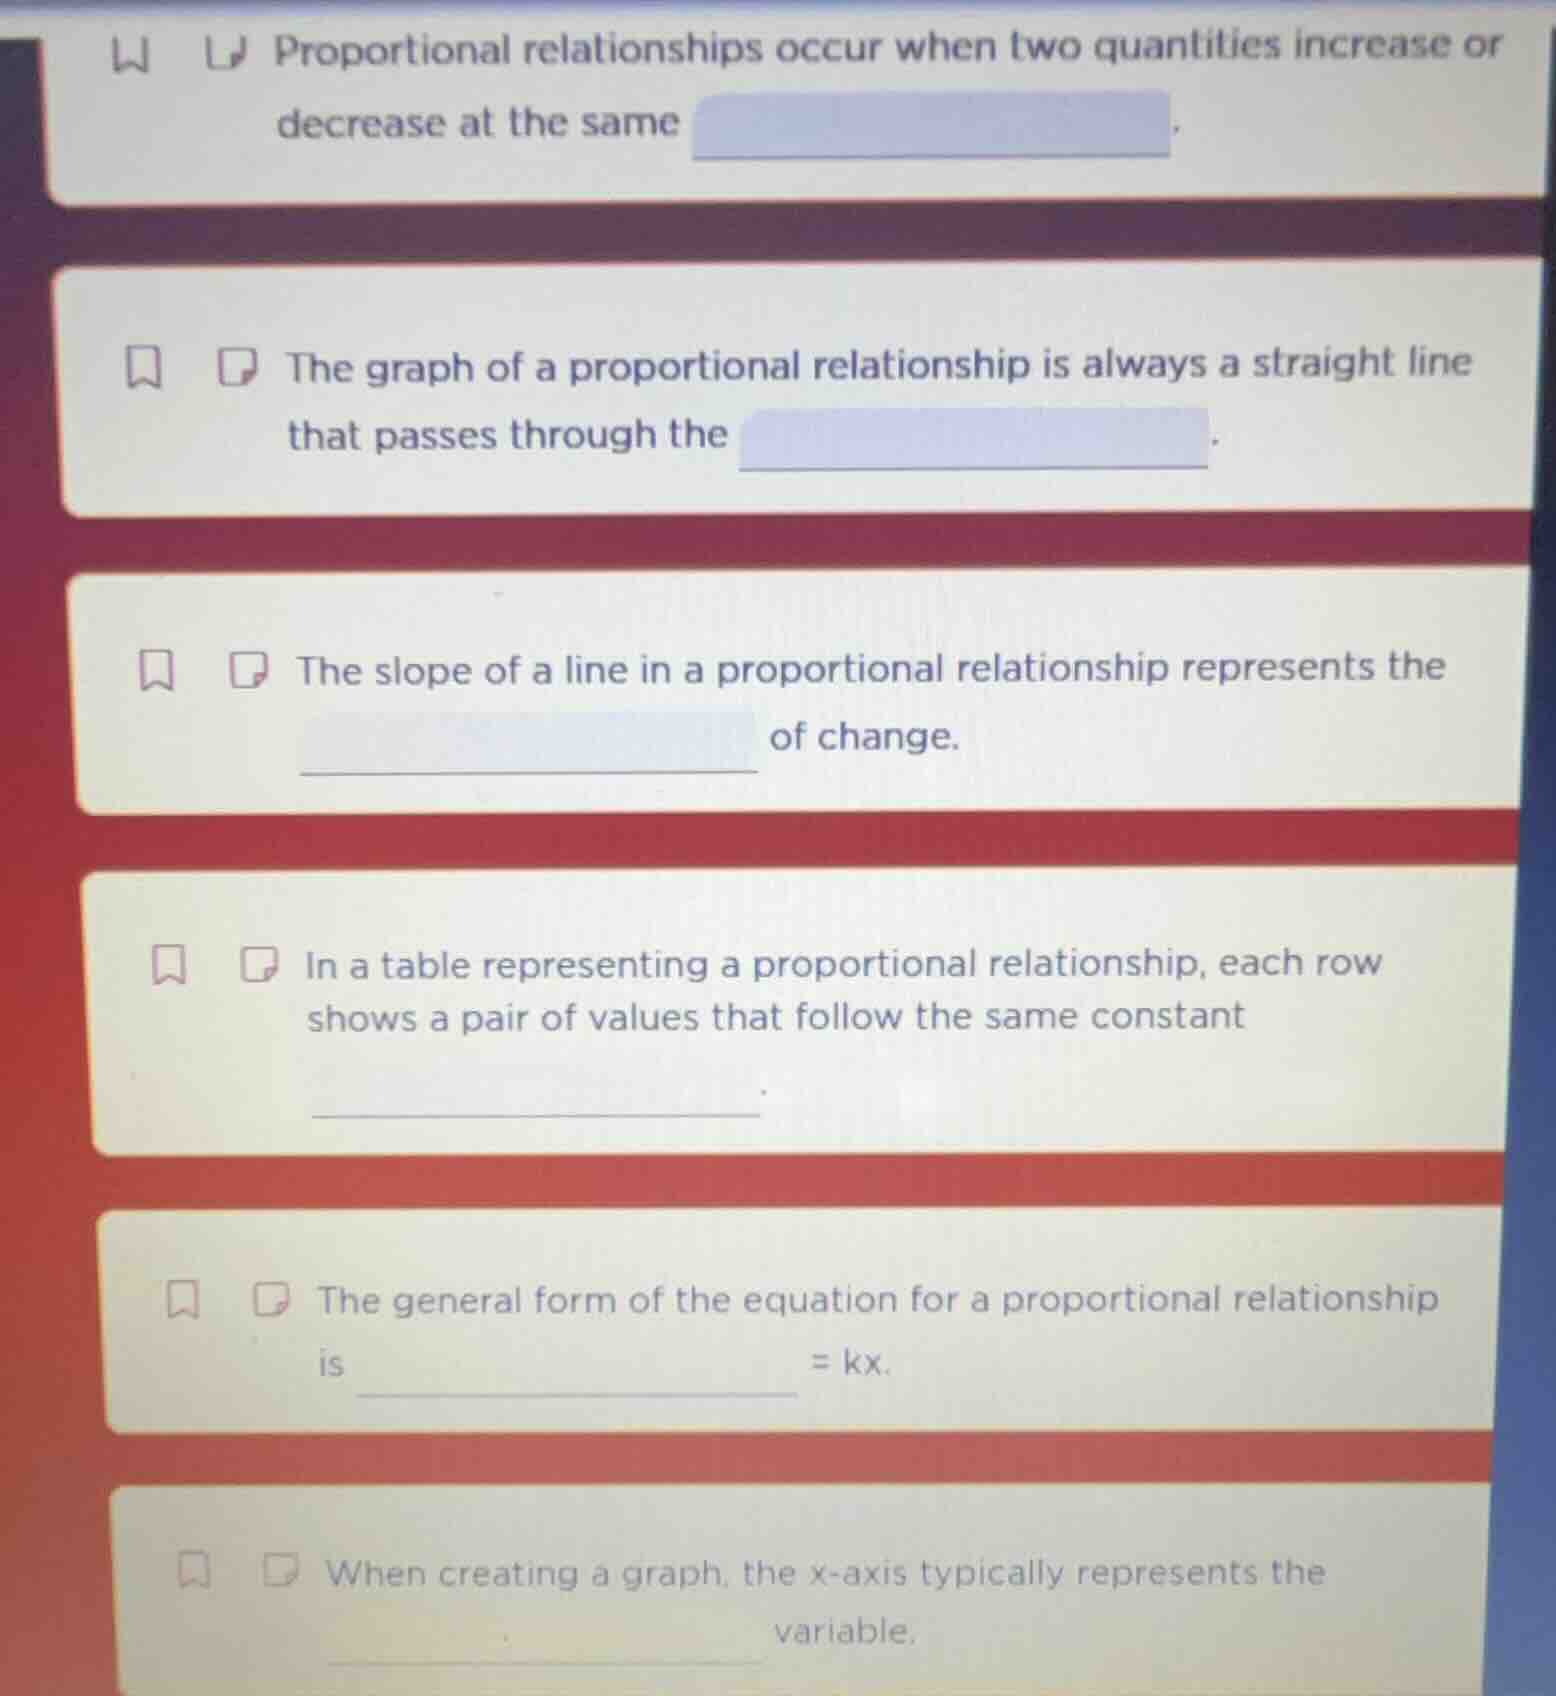
proportional relationships occur when two quantities increase or decrease at the same ____. the graph of a proportional relationship is always a straight line that passes through the __. the slope of a line in a proportional relationship represents the __ of change. in a table representing a proportional relationship, each row shows a pair of values that follow the same constant __. the general form of the equation for a proportional relationship is __ = kx. when creating a graph, the x - axis typically represents the ____ variable.
1st Blank:
Proportional relationships involve two quantities changing at a consistent rate (same ratio). So the word here is "rate".
The graph of a proportional relationship (\(y = kx\)) is a straight line passing through the origin \((0,0)\) since when \(x = 0\), \(y=0\).
In a proportional relationship \(y=kx\), the slope \(k\) is the constant rate of change (how much \(y\) changes per unit \(x\) change).

Snap & solve any problem in the app
Get step-by-step solutions on Sovi AI
Photo-based solutions with guided steps
Explore more problems and detailed explanations
rate