QUESTION IMAGE
Question
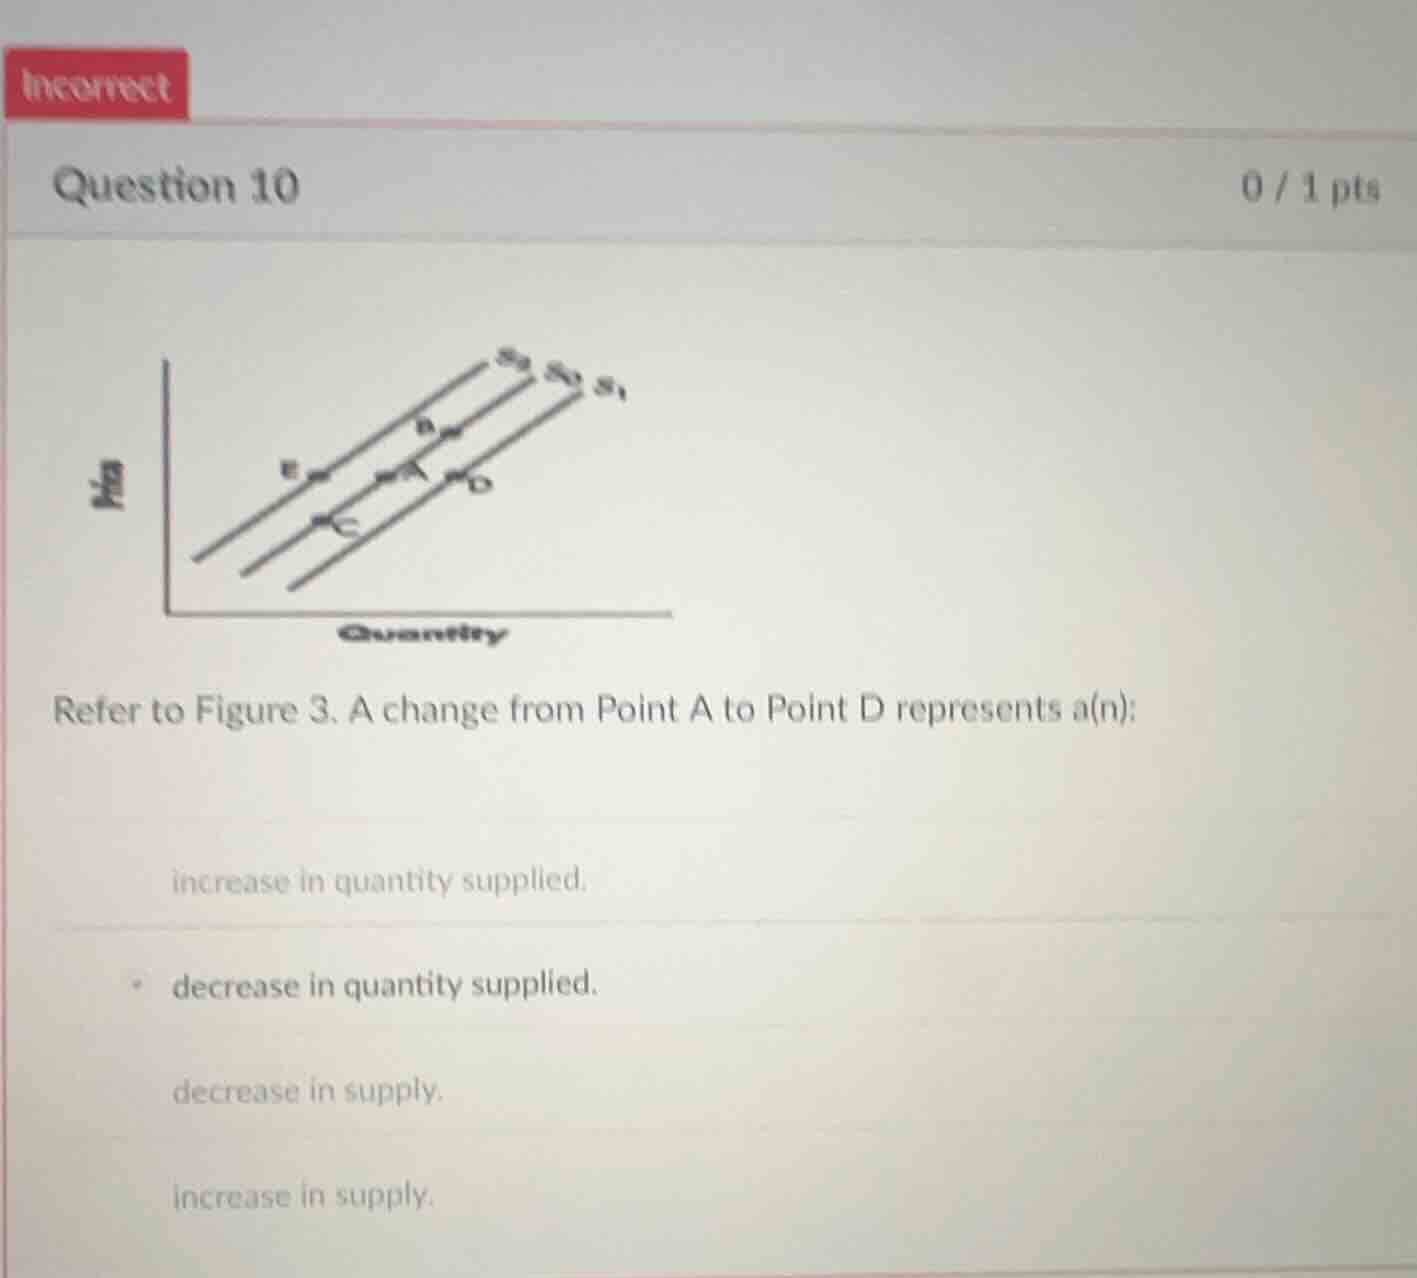
question 10 0 / 1 pts refer to figure 3. a change from point a to point d represents a(n): increase in quantity supplied. decrease in quantity supplied. decrease in supply. increase in supply.
Brief Explanations
A movement along the same supply curve (from Point A to Point D on curve $S_1$) occurs when only price changes, leading to a higher quantity supplied at a higher price. A shift of the entire supply curve would be a change in supply, but this is a movement along one curve.

Snap & solve any problem in the app
Get step-by-step solutions on Sovi AI
Photo-based solutions with guided steps
Explore more problems and detailed explanations
increase in quantity supplied.