QUESTION IMAGE
Question
question #13
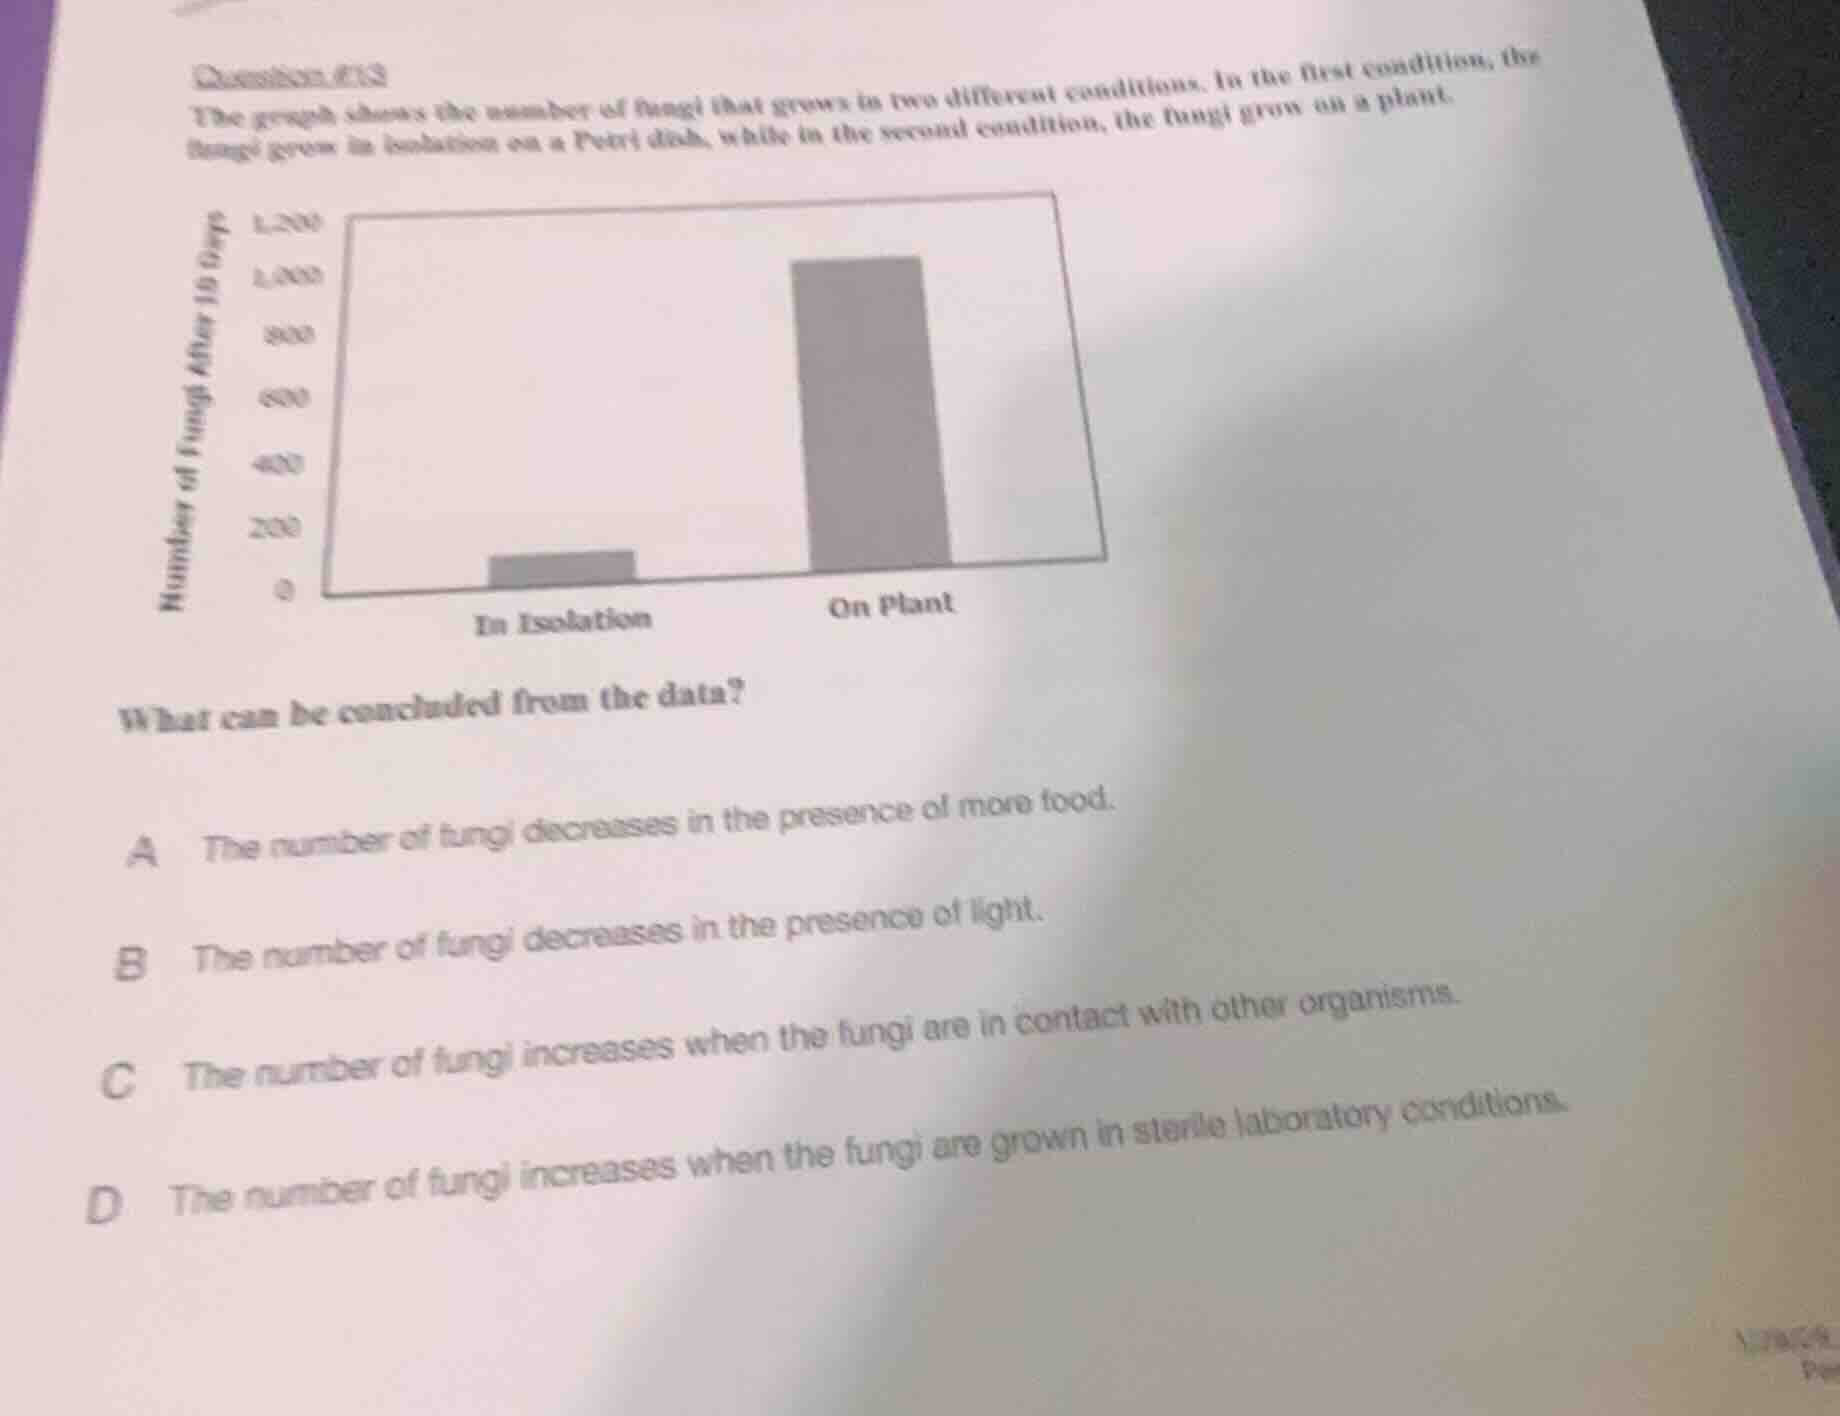
the graph shows the number of fungi that grows in two different conditions. in the first condition, the fungi grow in isolation on a petri dish, while in the second condition, the fungi grow on a plant.
what can be concluded from the data?
a the number of fungi decreases in the presence of more food.
b the number of fungi decreases in the presence of light.
c the number of fungi increases when the fungi are in contact with other organisms.
d the number of fungi increases when the fungi are grown in sterile laboratory conditions.
- Option A: The graph shows more fungi on the plant (where there is likely more food) than in isolation, so A is incorrect.
- Option B: The graph does not provide any information about light, so B is incorrect.
- Option C: When fungi grow on a plant (in contact with other organisms), the number of fungi is much higher than when they grow in isolation, so this statement is supported by the data.
- Option D: The graph shows fewer fungi in isolation (sterile laboratory - like conditions) than on the plant, so D is incorrect.

Snap & solve any problem in the app
Get step-by-step solutions on Sovi AI
Photo-based solutions with guided steps
Explore more problems and detailed explanations
C. The number of fungi increases when the fungi are in contact with other organisms.