QUESTION IMAGE
Question
question 23 of 25
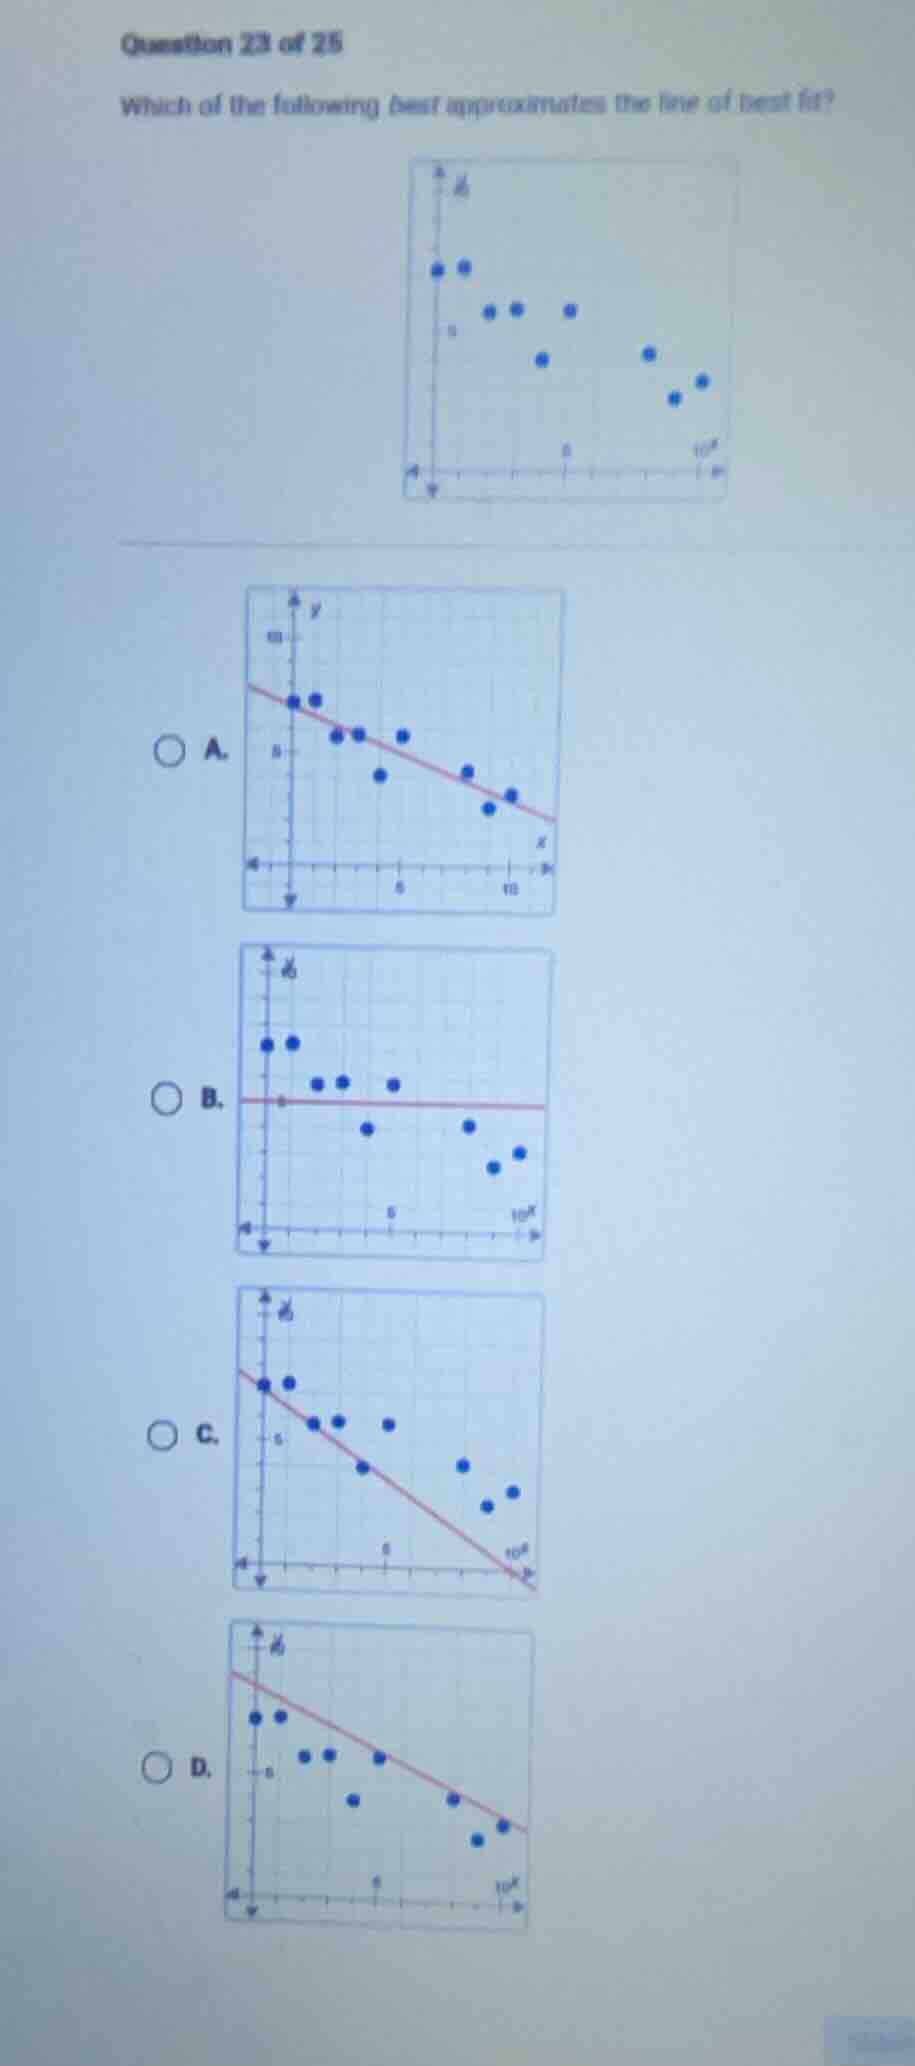
which of the following best approximates the line of best fit?
a.
b.
c.
d.
Step1: Identify trend of scatter plot
The original scatter plot shows a moderate negative linear trend: as $x$ increases, $y$ decreases, and points are clustered around a downward-sloping line (not extremely steep, not flat).
Step2: Match trend to options
- Option A: Has a gentle negative slope, with points evenly distributed around the line, matching the original trend.
- Option B: Flat line, does not match the negative trend.
- Option C: Extremely steep negative slope, does not match the original's gentle decline.
- Option D: Line is too low, most upper points are far above it, not a good fit.

Snap & solve any problem in the app
Get step-by-step solutions on Sovi AI
Photo-based solutions with guided steps
Explore more problems and detailed explanations
A. <The scatter plot with a gently downward-sloping line of best fit matching the original point distribution>