QUESTION IMAGE
Question
question
part 1 of 3 completed: 8 of 9 | my score: 7.67/9 pts (85.19%)
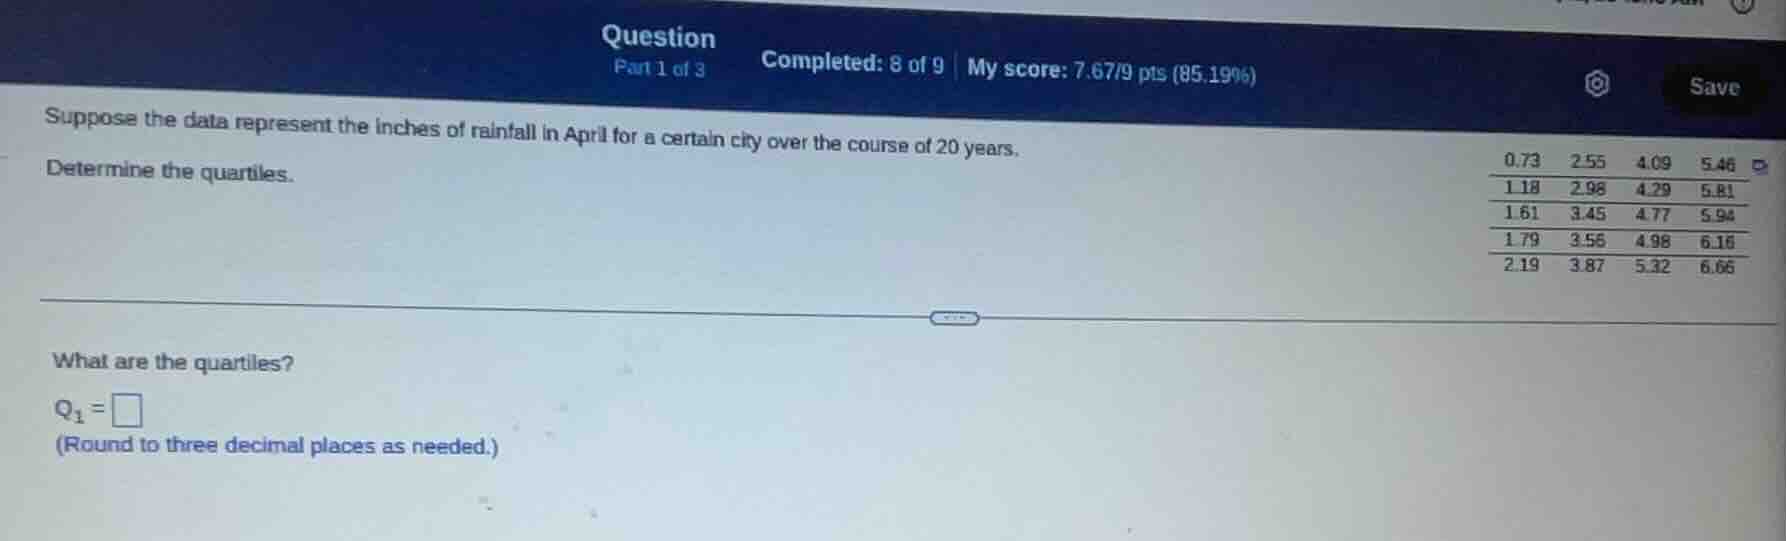
suppose the data represent the inches of rainfall in april for a certain city over the course of 20 years.
determine the quartiles.
0.73 2.55 4.09 5.46
1.18 2.98 4.29 5.81
1.61 3.45 4.77 5.94
1.79 3.56 4.98 6.16
2.19 3.87 5.32 6.66
what are the quartiles?
$q_1 = \square$
(round to three decimal places as needed.)
Step1: Sort all data ascendingly
0.73, 1.18, 1.61, 1.79, 2.19, 2.55, 2.98, 3.45, 3.56, 3.87, 4.09, 4.29, 4.77, 4.98, 5.32, 5.46, 5.81, 5.94, 6.16, 6.66
Step2: Find position of $Q_1$
Position = $\frac{1}{4}(n+1) = \frac{1}{4}(20+1) = 5.25$
Step3: Calculate $Q_1$ value
$Q_1 = 2.19 + 0.25\times(2.55-2.19) = 2.19 + 0.09 = 2.280$

Snap & solve any problem in the app
Get step-by-step solutions on Sovi AI
Photo-based solutions with guided steps
Explore more problems and detailed explanations
$Q_1 = 2.280$