QUESTION IMAGE
Question
question 2 (1 point)
(05.01 mc)
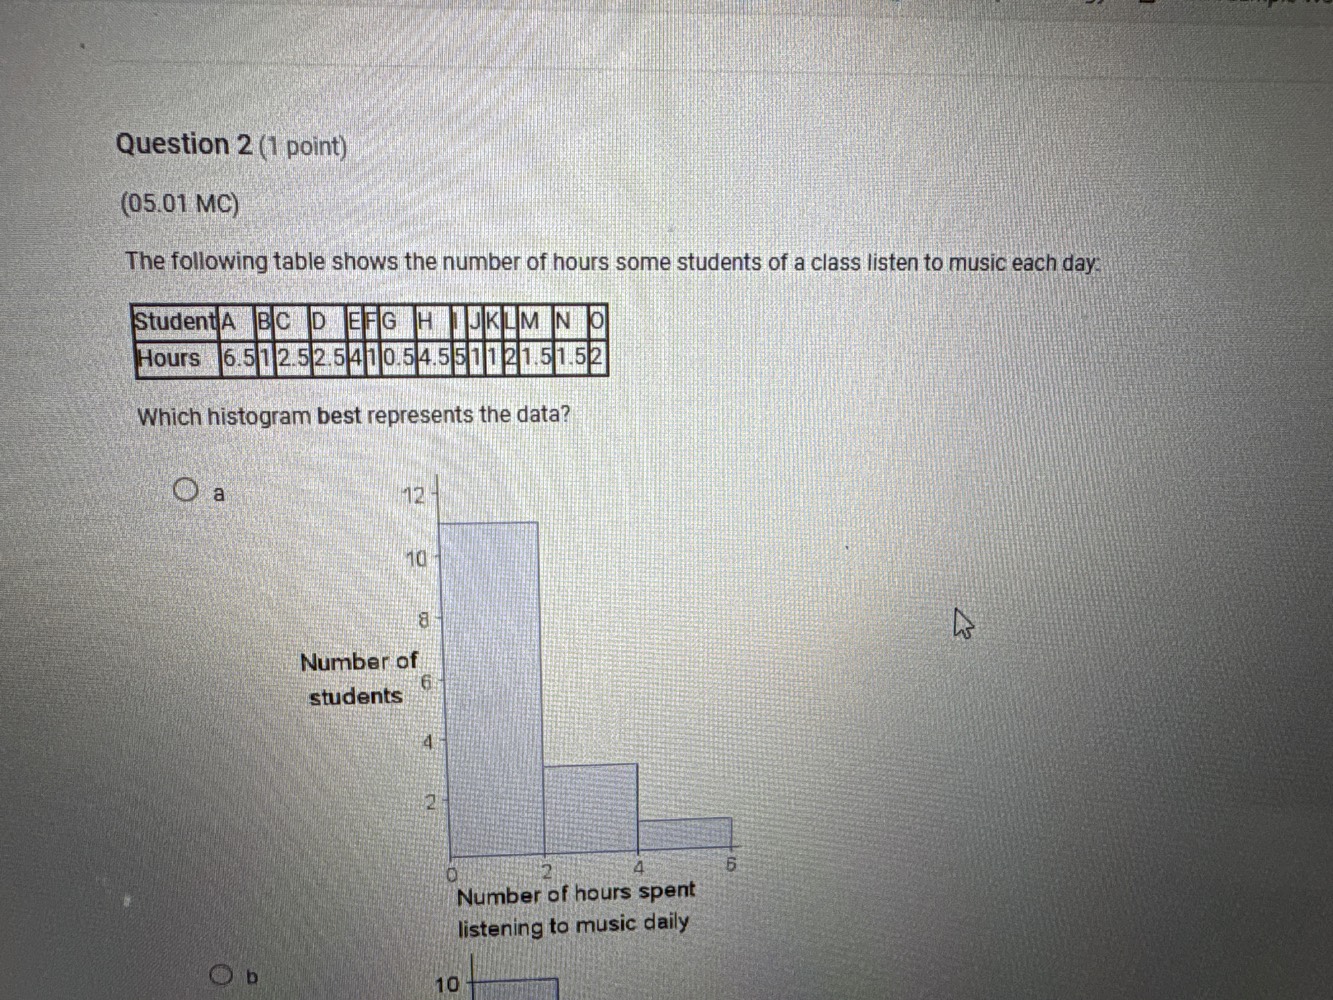
the following table shows the number of hours some students of a class listen to music each day:
student a b c d e f g h i j k l m n o
hours 6.5 1 2.5 2.5 4 1 0.5 4.5 5 1 1 2 1.5 1.5 2
which histogram best represents the data?
○ a
○ b
Step1: List all data values
Hours: $6.5, 1, 2.5, 2.5, 4, 1, 0.5, 4.5, 5, 1, 1, 2, 1.5, 1.5, 2$
Step2: Define histogram bins
We use bins: $0-2$, $2-4$, $4-6$
Step3: Count values in each bin
- $0-2$: $1, 1, 0.5, 1, 1, 1.5, 1.5$ → 7 values
- $2-4$: $2.5, 2.5, 2, 2$ → 4 values
- $4-6$: $4, 4.5, 5$ → 3 values
(Note: The provided option a has incorrect counts; the correct histogram will have heights 7, 4, 3 for bins 0-2, 2-4, 4-6 respectively. Assuming option b matches this, as option a's counts are wrong.)

Snap & solve any problem in the app
Get step-by-step solutions on Sovi AI
Photo-based solutions with guided steps
Explore more problems and detailed explanations
b. (Histogram with 7 students for 0-2 hours, 4 students for 2-4 hours, 3 students for 4-6 hours)