QUESTION IMAGE
Question
question 3 of 9, step 2 of 2
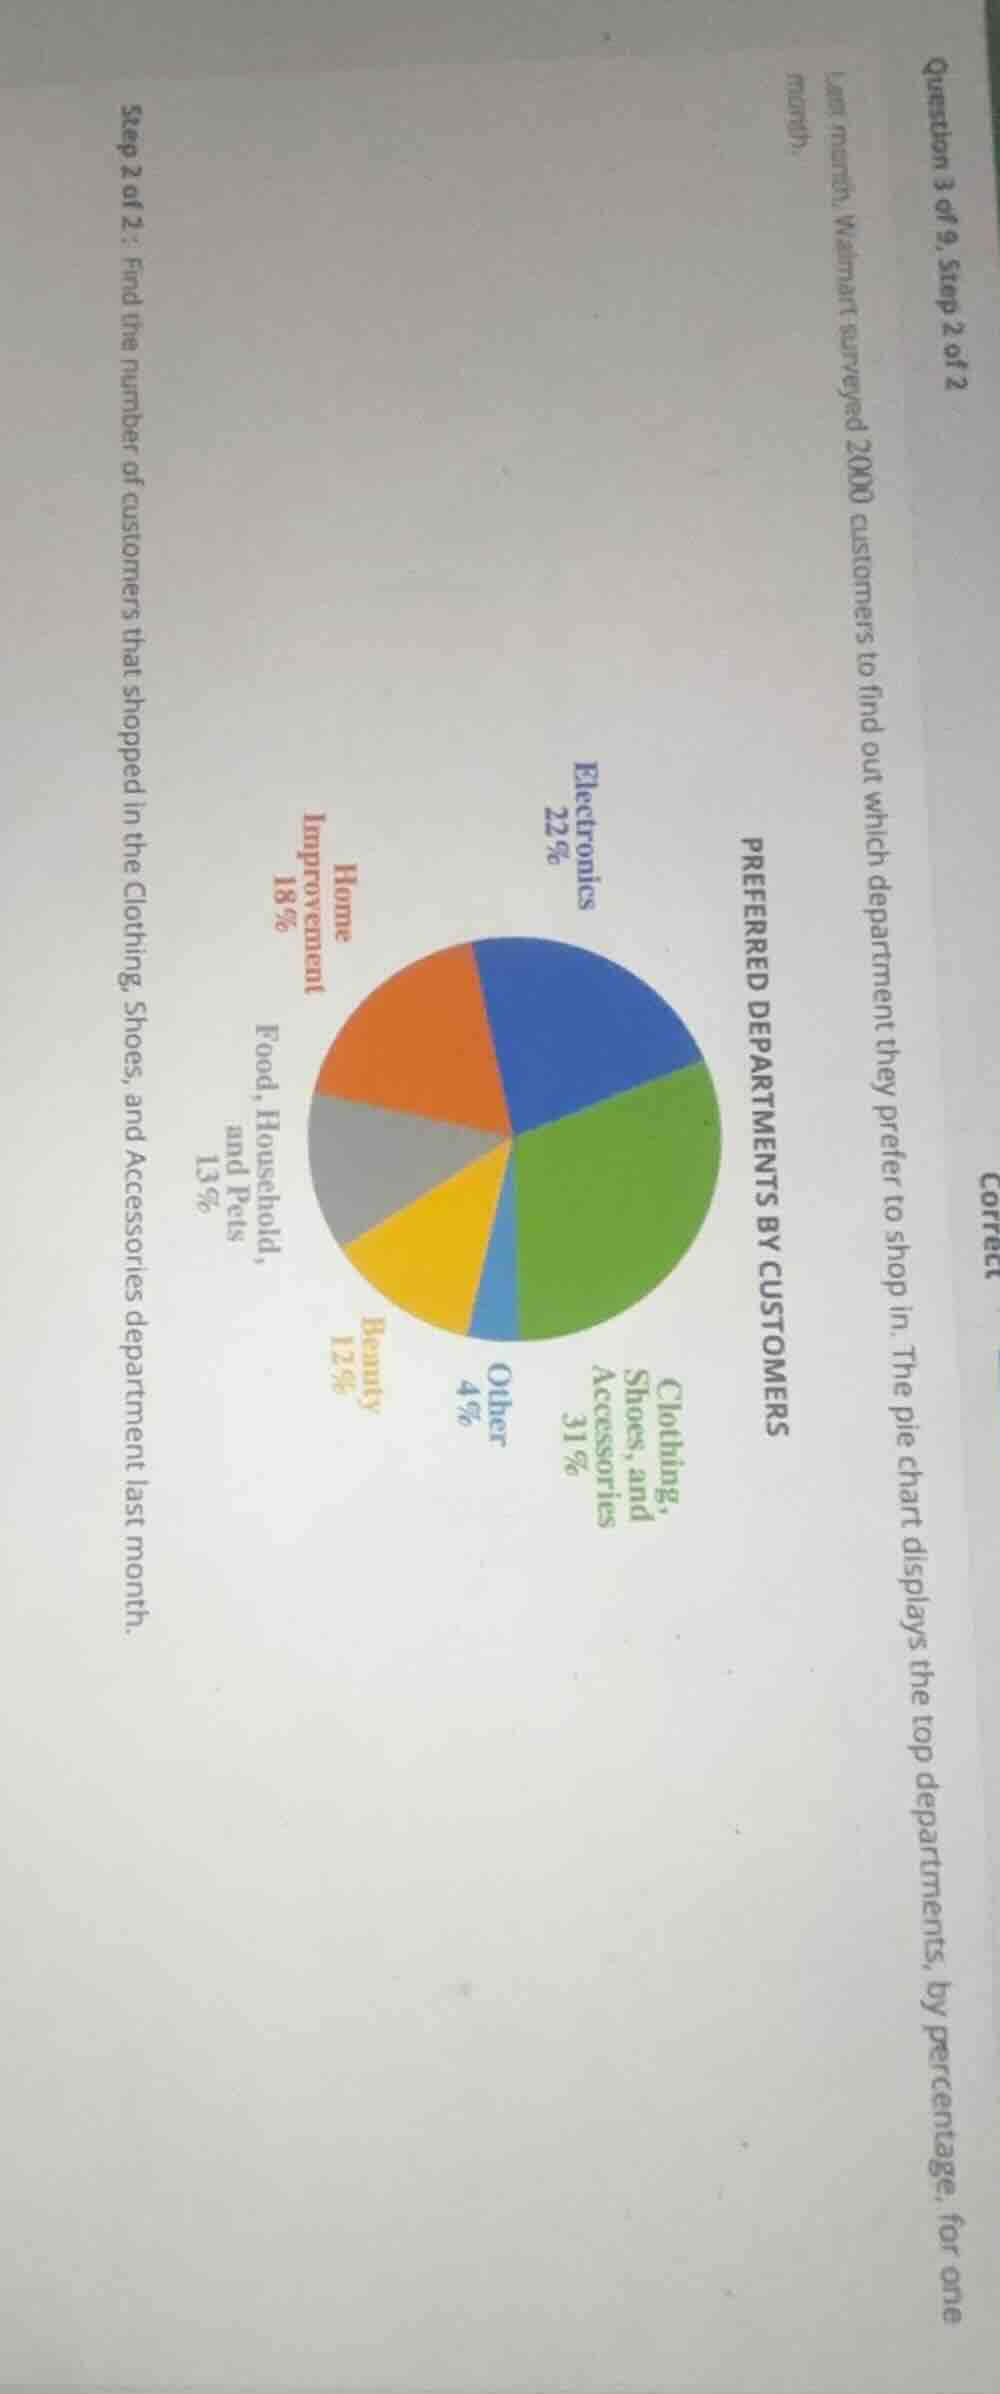
last month, walmart surveyed 2000 customers to find out which department they prefer to shop in. the pie chart displays the top departments, by percentage, for one month.
preferred departments by customers
clothing, shoes, and accessories: 31%
other: 4%
beauty: 12%
food, household, and pets: 13%
home improvement: 18%
electronics: 22%
step 2 of 2: find the number of customers that shopped in the clothing, shoes, and accessories department last month.
Step1: Identify relevant percentage
The percentage for Clothing, Shoes, and Accessories is 31%, or $0.31$ in decimal form.
Step2: Calculate number of customers
Multiply total customers by the decimal percentage.
$2000 \times 0.31$

Snap & solve any problem in the app
Get step-by-step solutions on Sovi AI
Photo-based solutions with guided steps
Explore more problems and detailed explanations
620