QUESTION IMAGE
Question
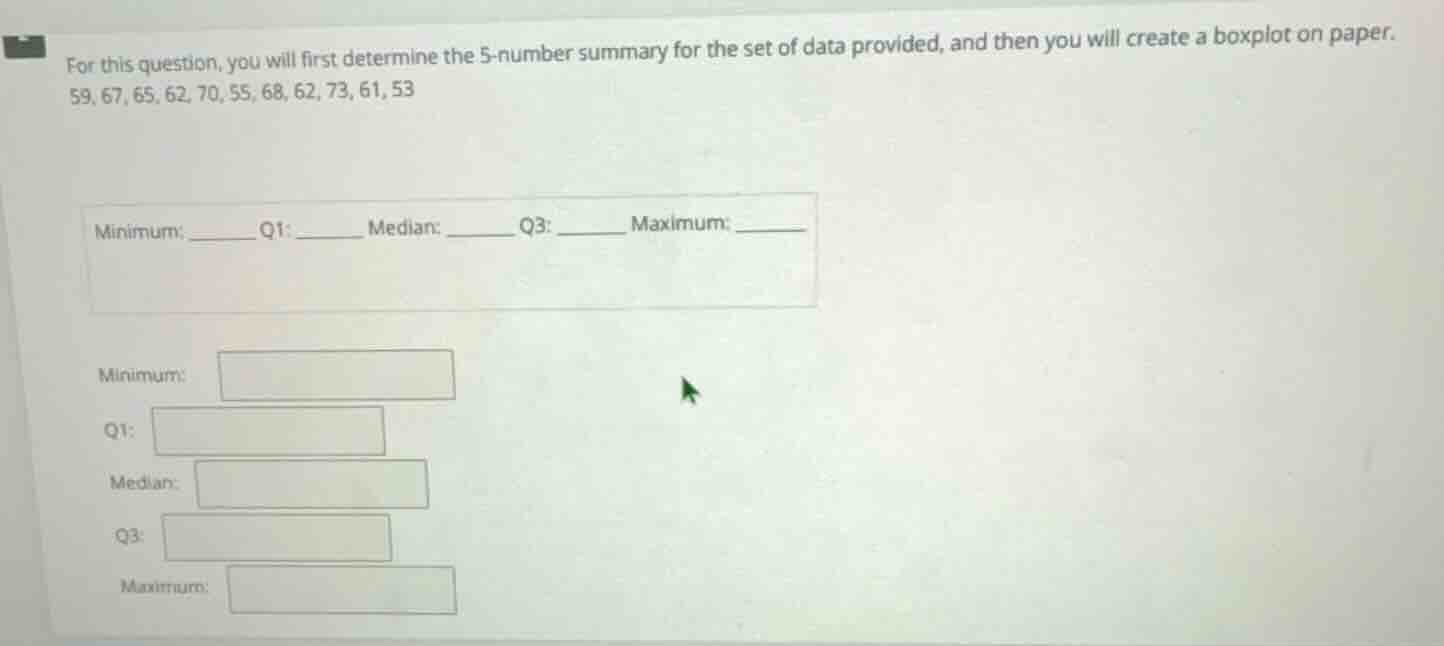
for this question, you will first determine the 5 - number summary for the set of data provided, and then you will create a boxplot on paper. 59, 67, 65, 62, 70, 55, 68, 62, 73, 61, 53
minimum: ____ q1: __ median: __ q3: __ maximum: ____
minimum:
q1:
median:
q3:
maximum:
Step1: Order the data
First, we order the given data set: 53, 55, 59, 61, 62, 62, 65, 67, 68, 70, 73.
Step2: Find the Minimum
The smallest value in the ordered data is 53. So, Minimum = 53.
Step3: Find the Median
The number of data points \( n = 11 \) (odd). The median is the middle value, which is the \( \frac{n + 1}{2}=\frac{11+ 1}{2}=6^{\text{th}} \) value. Looking at the ordered data, the \( 6^{\text{th}} \) value is 62. So, Median = 62.
Step4: Find Q1 (First Quartile)
Q1 is the median of the lower half of the data. The lower half of the data (excluding the median) is: 53, 55, 59, 61, 62. The number of data points in the lower half \( n_{lower}=5 \) (odd). The median of this lower half is the \( \frac{5 + 1}{2}=3^{\text{rd}} \) value. The \( 3^{\text{rd}} \) value in 53, 55, 59, 61, 62 is 59. So, Q1 = 59.
Step5: Find Q3 (Third Quartile)
Q3 is the median of the upper half of the data. The upper half of the data (excluding the median) is: 65, 67, 68, 70, 73. The number of data points in the upper half \( n_{upper}=5 \) (odd). The median of this upper half is the \( \frac{5+ 1}{2}=3^{\text{rd}} \) value. The \( 3^{\text{rd}} \) value in 65, 67, 68, 70, 73 is 68. So, Q3 = 68.
Step6: Find the Maximum
The largest value in the ordered data is 73. So, Maximum = 73.

Snap & solve any problem in the app
Get step-by-step solutions on Sovi AI
Photo-based solutions with guided steps
Explore more problems and detailed explanations
Minimum: 53
Q1: 59
Median: 62
Q3: 68
Maximum: 73