QUESTION IMAGE
Question
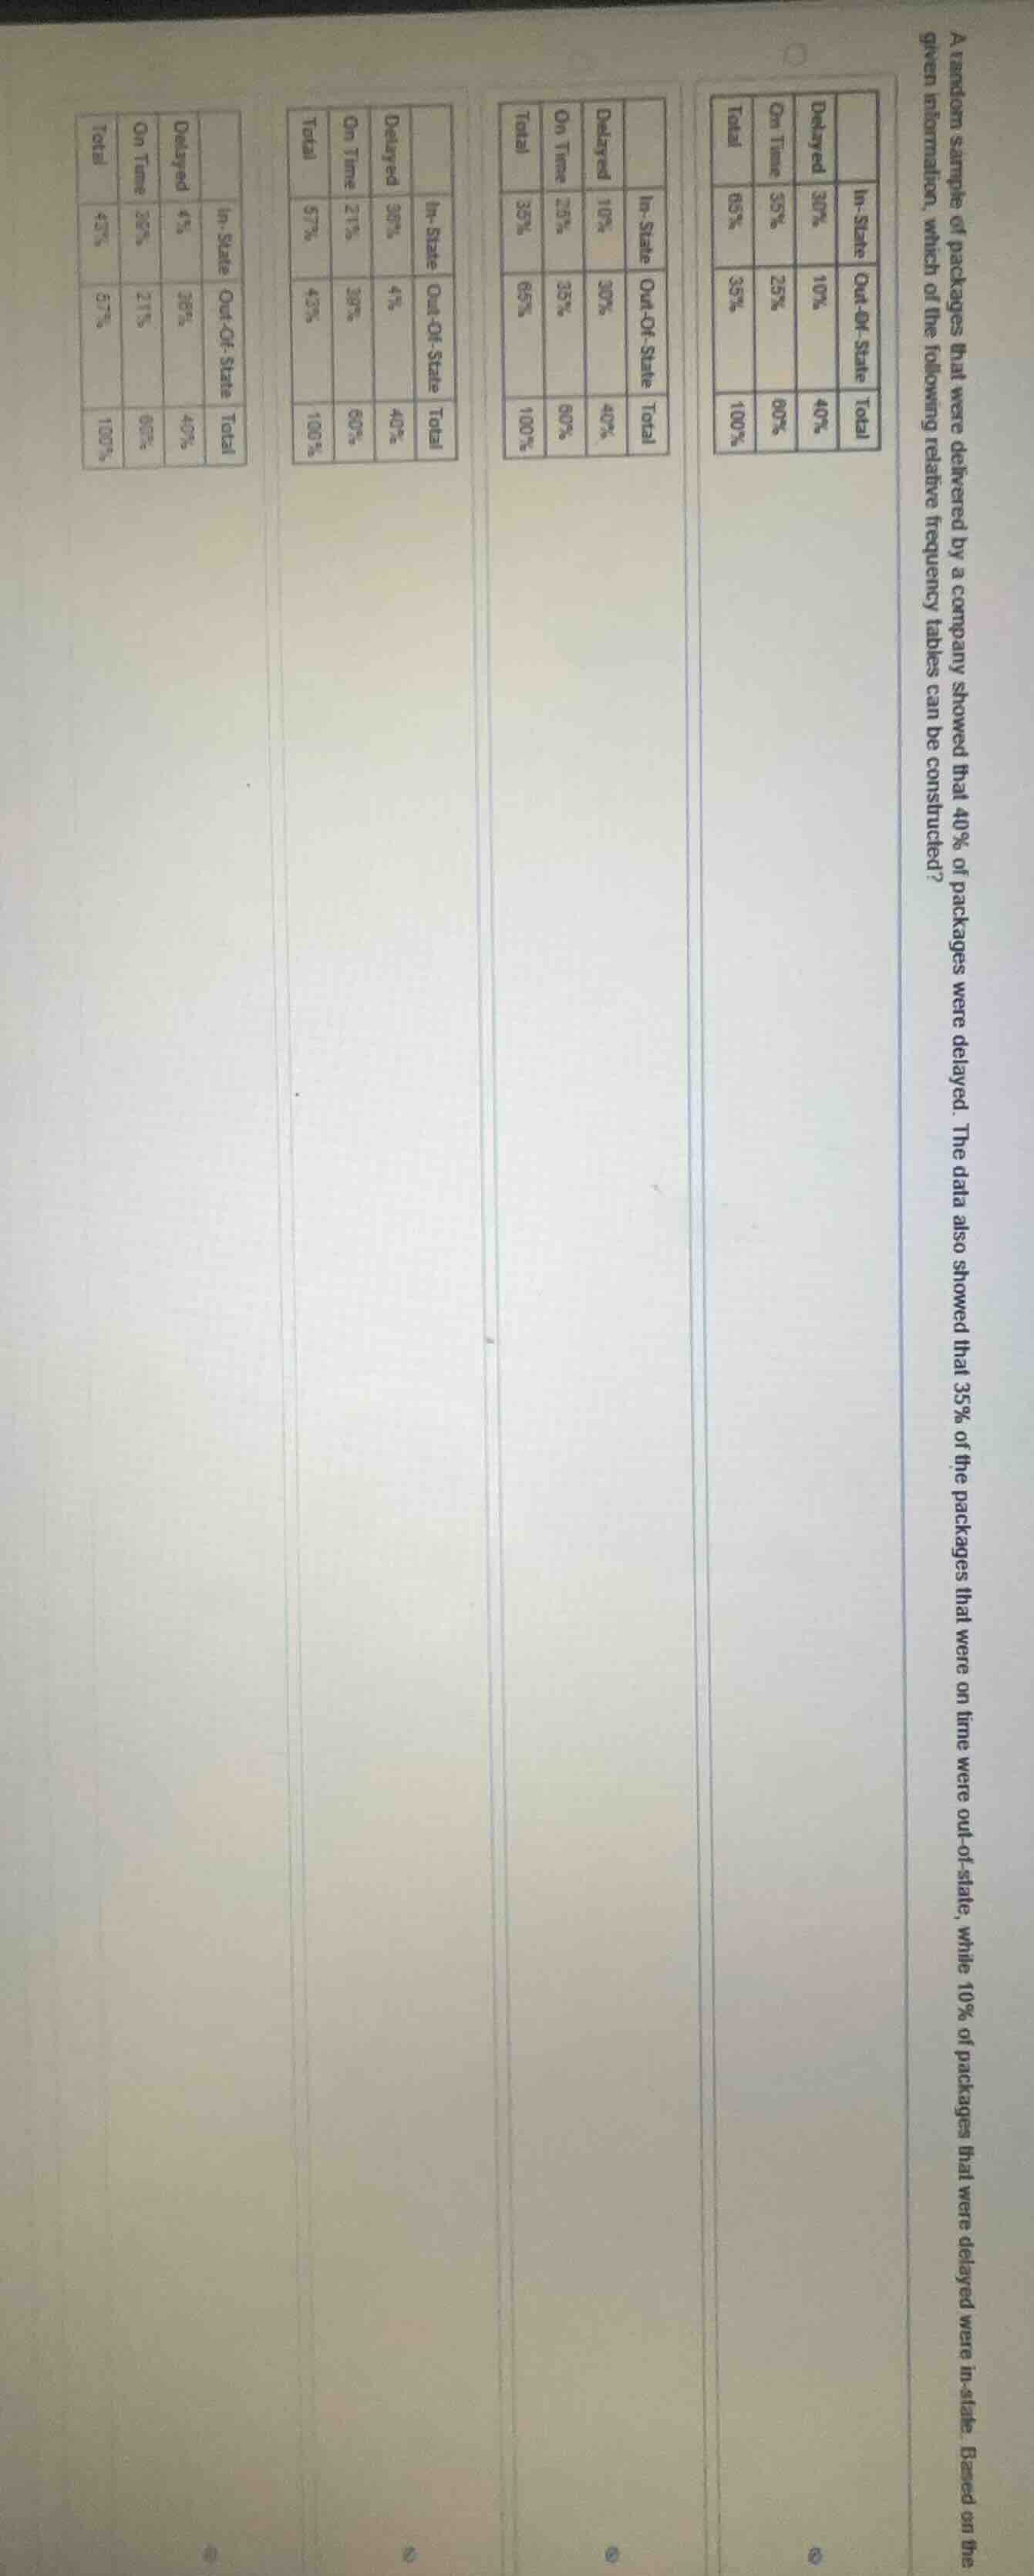
a random sample of packages that were delivered by a company showed that 40% of packages were delayed. the data also showed that 35% of the packages that were on time were out - of - state, while 10% of packages that were delayed were in - state. based on the given information, which of the following relative frequency tables can be constructed?
(then there are four relative frequency tables with columns: in - state, out - of - state, total; and rows: delayed, on time, total, each with corresponding percentage values.)
Step1: Define given probabilities
Let $P(D) = 0.40$ (delayed total), $P(O|T) = 0.35$ (out-of-state | on time), $P(I|D) = 0.10$ (in-state | delayed).
First, calculate $P(T) = 1 - P(D) = 1 - 0.40 = 0.60$ (on time total).
Step2: Calculate joint probabilities
- $P(I \cap D) = P(I|D) \times P(D) = 0.10 \times 0.40 = 0.10$
- $P(O \cap D) = P(D) - P(I \cap D) = 0.40 - 0.10 = 0.30$
- $P(O \cap T) = P(O|T) \times P(T) = 0.35 \times 0.60 = 0.21$
- $P(I \cap T) = P(T) - P(O \cap T) = 0.60 - 0.21 = 0.39$
Step3: Calculate row/column totals
- $P(I) = P(I \cap T) + P(I \cap D) = 0.39 + 0.10 = 0.49$
- $P(O) = P(O \cap T) + P(O \cap D) = 0.21 + 0.30 = 0.51$
Step4: Convert to relative frequencies
- In-State Delayed: $\frac{P(I \cap D)}{P(I)} = \frac{0.10}{0.49} \approx 0.204 \approx 20\%$
- In-State On Time: $\frac{P(I \cap T)}{P(I)} = \frac{0.39}{0.49} \approx 0.796 \approx 80\%$
- Out-of-State Delayed: $\frac{P(O \cap D)}{P(O)} = \frac{0.30}{0.51} \approx 0.588 \approx 59\%$
- Out-of-State On Time: $\frac{P(O \cap T)}{P(O)} = \frac{0.21}{0.51} \approx 0.412 \approx 41\%$
- Total Delayed: $\frac{P(D)}{1} = 40\%$, Total On Time: $\frac{P(T)}{1} = 60\%$
- Total In-State: $49\%$, Total Out-of-State: $51\%$
Verify the second table matches these values (rounded):
| In-State | Out-Of-State | Total | |
|---|---|---|---|
| On Time | 39% | 21% | 60% |
| Total | 49% | 51% | 100% |
(Note: The table uses column percentages: $\frac{10}{49}\approx20\%$, $\frac{30}{51}\approx59\%$, $\frac{39}{49}\approx80\%$, $\frac{21}{51}\approx41\%$, which matches the second option.)

Snap & solve any problem in the app
Get step-by-step solutions on Sovi AI
Photo-based solutions with guided steps
Explore more problems and detailed explanations
The correct relative frequency table is the second one (from the top):
| In-State | Out-Of-State | Total | |
|---|---|---|---|
| On Time | 80% | 41% | 60% |
| Total | 100% | 100% | 100% |
(Or the equivalent table with joint frequencies in the cells:
| In-State | Out-Of-State | Total | ||
|---|---|---|---|---|
| On Time | 39% | 21% | 60% | |
| Total | 49% | 51% | 100% | ) |