QUESTION IMAGE
Question
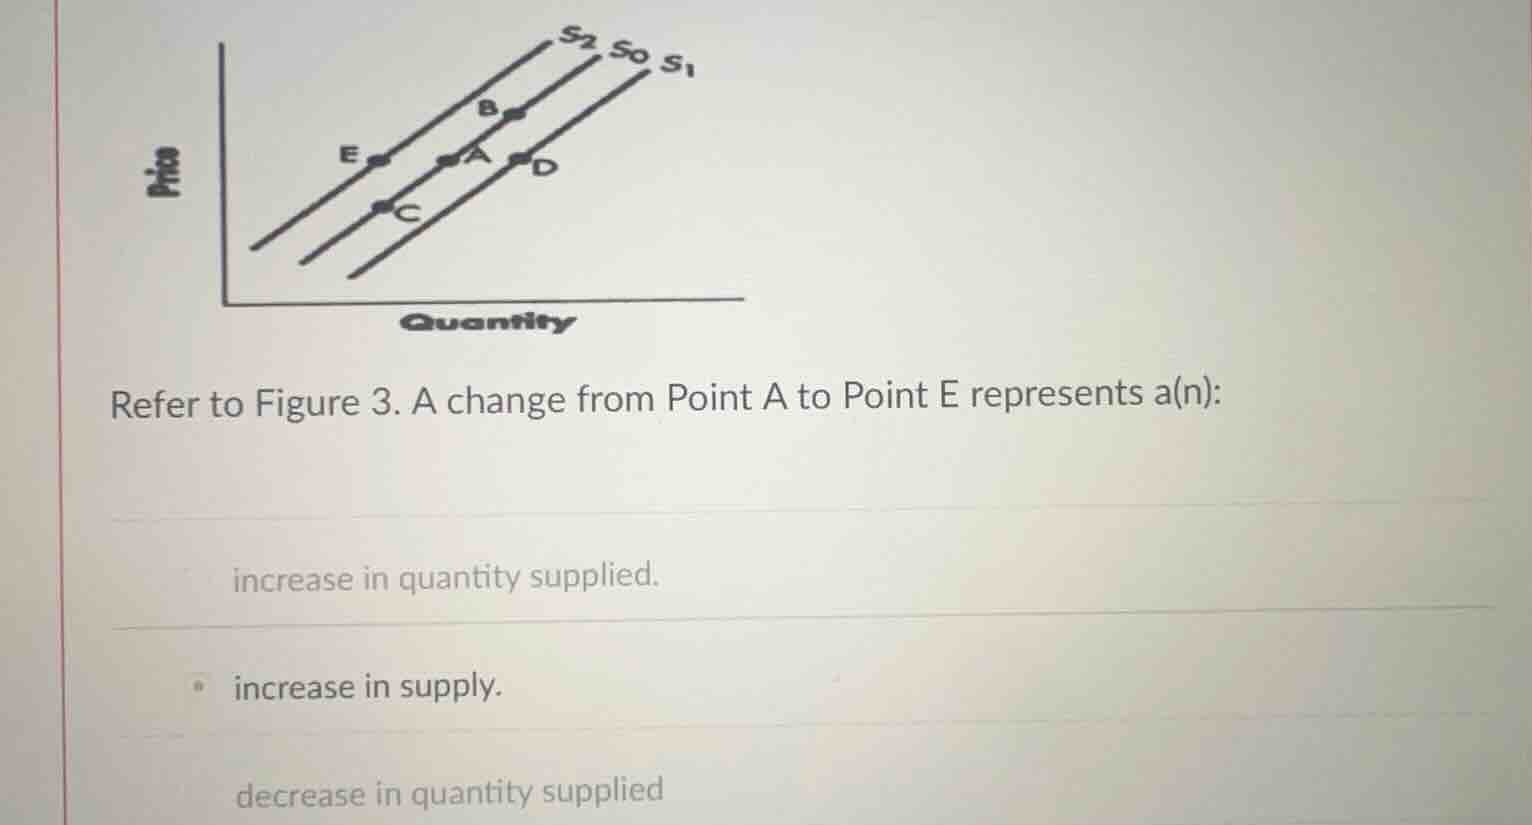
refer to figure 3. a change from point a to point e represents a(n):
increase in quantity supplied.
increase in supply.
decrease in quantity supplied
A shift from point A (on supply curve $S_0$) to point E (on supply curve $S_2$) shows that at the same price level, the quantity supplied is lower, which is a leftward shift of the supply curve. This type of shift across different supply curves represents a decrease in supply. The options provided include:
- "increase in quantity supplied" refers to movement along the same supply curve, not a shift between curves.
- "increase in supply" refers to a rightward shift of the supply curve, which is the opposite of the observed change.
- "decrease in quantity supplied" refers to downward movement along a single supply curve, not a shift between curves.
The correct description of the shift from A to E is a decrease in supply, which aligns with the leftward shift of the supply curve.

Snap & solve any problem in the app
Get step-by-step solutions on Sovi AI
Photo-based solutions with guided steps
Explore more problems and detailed explanations
decrease in supply.