QUESTION IMAGE
Question
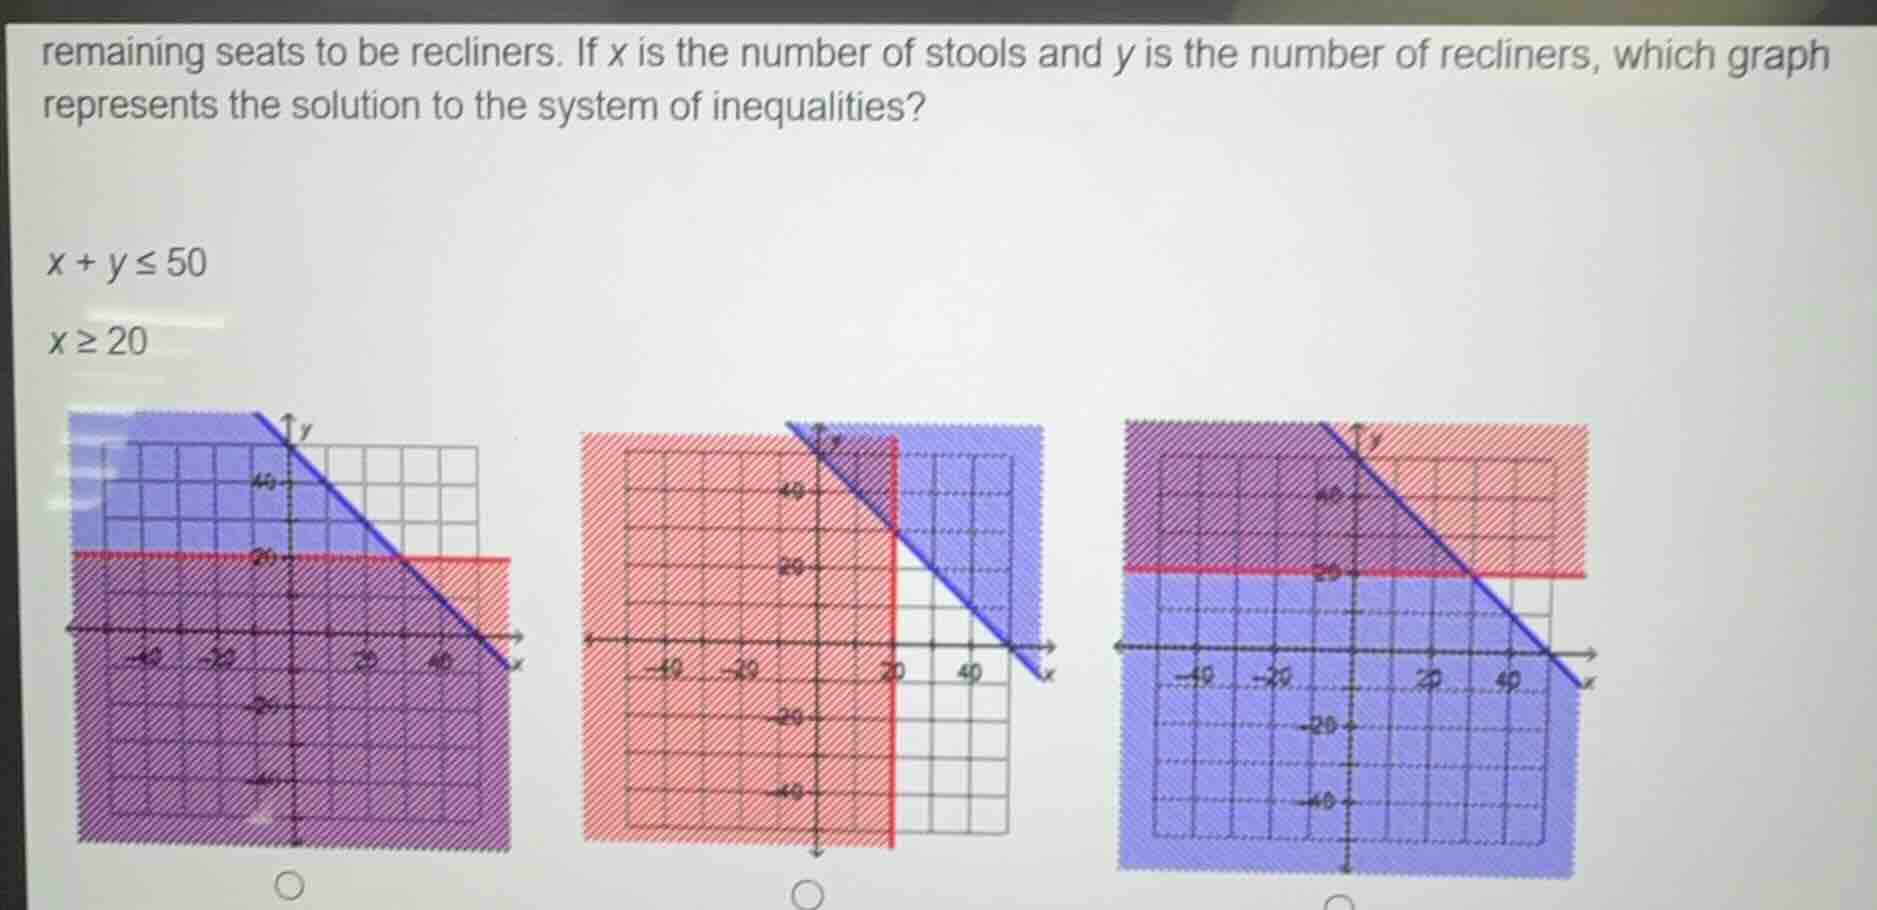
remaining seats to be recliners. if x is the number of stools and y is the number of recliners, which graph represents the solution to the system of inequalities?
$x + y \leq 50$
$x \geq 20$
Step1: Analyze $x \geq 20$
This inequality represents all points to the right of the vertical line $x=20$ (including the line itself, so the line is solid).
Step2: Analyze $x + y \leq 50$
Rewrite in slope-intercept form: $y \leq -x + 50$. This is all points below/on the solid line $y=-x+50$, which has a y-intercept of 50 and x-intercept of 50.
Step3: Find overlapping region
The solution is the area that satisfies both inequalities: right of $x=20$ and below $y=-x+50$.

Snap & solve any problem in the app
Get step-by-step solutions on Sovi AI
Photo-based solutions with guided steps
Explore more problems and detailed explanations
The correct graph is the rightmost graph (third option), which shows the overlapping region of the area to the right of the solid vertical line $x=20$ and below the solid line $x+y=50$.