QUESTION IMAGE
Question
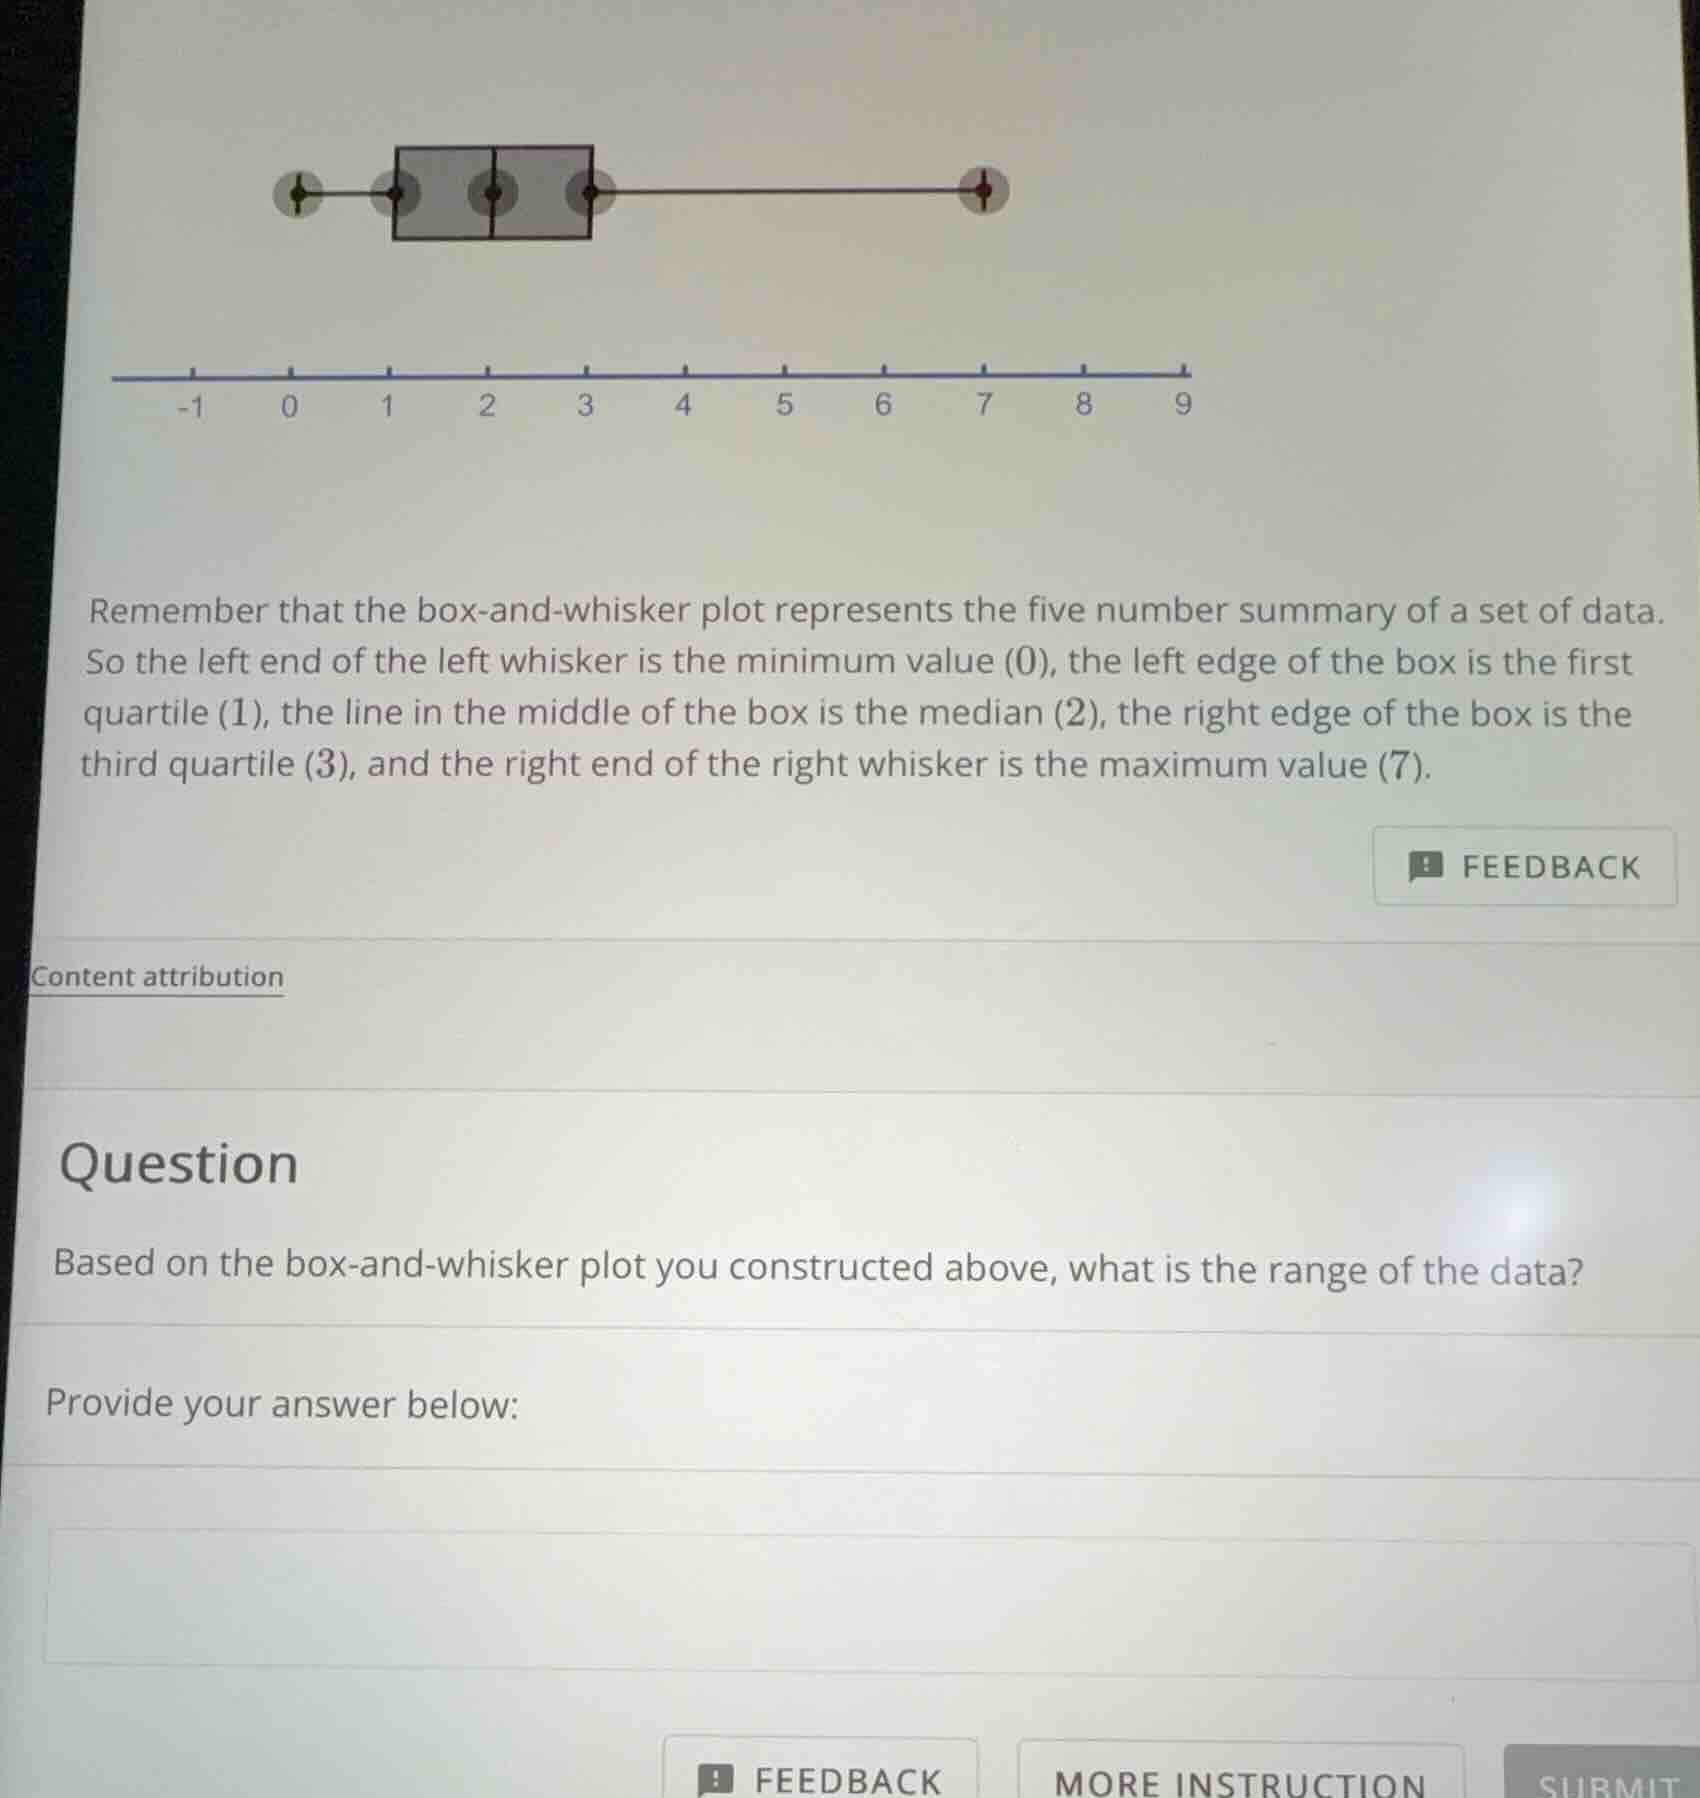
remember that the box-and-whisker plot represents the five number summary of a set of data. so the left end of the left whisker is the minimum value (0), the left edge of the box is the first quartile (1), the line in the middle of the box is the median (2), the right edge of the box is the third quartile (3), and the right end of the right whisker is the maximum value (7). question based on the box-and-whisker plot you constructed above, what is the range of the data? provide your answer below:
Step1: Recall the formula for range
The range of a data set is calculated as the difference between the maximum value and the minimum value, i.e., \( \text{Range} = \text{Maximum} - \text{Minimum} \).
Step2: Identify maximum and minimum values
From the box - and - whisker plot description, the minimum value (\( \text{Minimum} \)) is 0 and the maximum value (\( \text{Maximum} \)) is 7.
Step3: Calculate the range
Substitute the values into the formula: \( \text{Range}=7 - 0=7 \).

Snap & solve any problem in the app
Get step-by-step solutions on Sovi AI
Photo-based solutions with guided steps
Explore more problems and detailed explanations
7