QUESTION IMAGE
Question
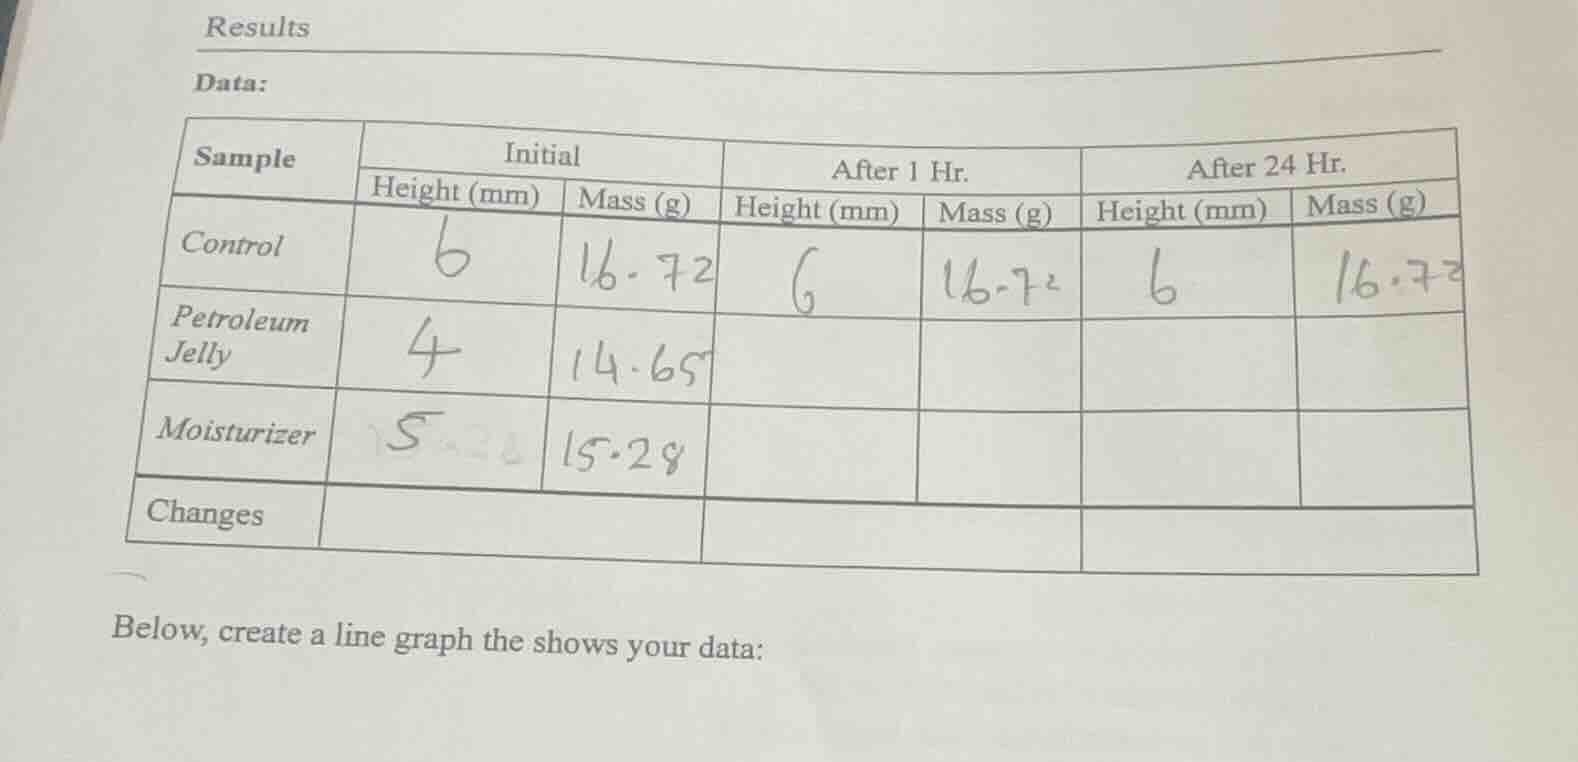
results
data:
sample | initial | after 1 hr. | after 24 hr.
| height (mm) | mass (g) | height (mm) | mass (g) | height (mm) | mass (g) |
control | 6 | 16.72 | 6 | 16.72 | 6 | 16.72
petroleum jelly | 4 | 14.65 | | | |
moisturizer | 5 | 15.28 | | | |
changes | | | | | |
below, create a line graph the shows your data:
To create a line graph for the given data, we follow these steps:
Step 1: Identify Variables
- X - axis (Independent Variable): Time (Initial, After 1 Hr, After 24 Hr)
- Y - axes:
- Height (mm) (for Control, Petroleum Jelly, Moisturizer)
- Mass (g) (for Control, Petroleum Jelly, Moisturizer)
Step 2: Organize Data Points
| Sample | Time | Height (mm) | Mass (g) |
|---|---|---|---|
| Control | After 1 Hr | 6 | 16.72 |
| Control | After 24 Hr | 6 | 16.72 |
| Petroleum Jelly | Initial | 4 | 14.65 |
| Petroleum Jelly | After 1 Hr | (missing) | (missing) |
| Petroleum Jelly | After 24 Hr | (missing) | (missing) |
| Moisturizer | Initial | 5 | 15.28 |
| Moisturizer | After 1 Hr | (missing) | (missing) |
| Moisturizer | After 24 Hr | (missing) | (missing) |
Step 3: Plotting the Graph
- For Height (mm):
- Plot three lines (one for each sample: Control, Petroleum Jelly, Moisturizer) with time on the x - axis and height on the y - axis.
- For the Control sample, the points are (Initial, 6), (After 1 Hr, 6), (After 24 Hr, 6). So it will be a horizontal line at \(y = 6\).
- For Petroleum Jelly, the initial height is 4. Since the other time - points' heights are missing, we can only plot the initial point (Initial, 4) for now.
- For Moisturizer, the initial height is 5. We can only plot the initial point (Initial, 5) for now.
- For Mass (g):
- Plot three lines (one for each sample: Control, Petroleum Jelly, Moisturizer) with time on the x - axis and mass on the y - axis.
- For the Control sample, the points are (Initial, 16.72), (After 1 Hr, 16.72), (After 24 Hr, 16.72). So it will be a horizontal line at \(y=16.72\).
- For Petroleum Jelly, the initial mass is 14.65. Since the other time - points' masses are missing, we can only plot the initial point (Initial, 14.65) for now.
- For Moisturizer, the initial mass is 15.28. We can only plot the initial point (Initial, 15.28) for now.
Step 4: Draw the Axes and Plot the Points
- Draw the x - axis and label it "Time (Initial, After 1 Hr, After 24 Hr)".
- Draw two y - axes (one for height and one for mass) and label them "Height (mm)" and "Mass (g)" respectively.
- Plot the points as described above and draw the lines (where data is available).
Since some of the data (after 1 hour and after 24 hours for Petroleum Jelly and Moisturizer) is missing, the graph will be partially complete with the available data points. If we assume that the experiment was intended to have complete data, we would need to fill in the missing values (either through actual measurement or by making assumptions based on the experimental design) to have a fully - fledged line graph.
If we were to present the graph with the available data, it would show the control sample having constant height and mass over time, while the Petroleum Jelly and Moisturizer samples have only their initial height and mass values plotted.

Snap & solve any problem in the app
Get step-by-step solutions on Sovi AI
Photo-based solutions with guided steps
Explore more problems and detailed explanations
To create a line graph for the given data, we follow these steps:
Step 1: Identify Variables
- X - axis (Independent Variable): Time (Initial, After 1 Hr, After 24 Hr)
- Y - axes:
- Height (mm) (for Control, Petroleum Jelly, Moisturizer)
- Mass (g) (for Control, Petroleum Jelly, Moisturizer)
Step 2: Organize Data Points
| Sample | Time | Height (mm) | Mass (g) |
|---|---|---|---|
| Control | After 1 Hr | 6 | 16.72 |
| Control | After 24 Hr | 6 | 16.72 |
| Petroleum Jelly | Initial | 4 | 14.65 |
| Petroleum Jelly | After 1 Hr | (missing) | (missing) |
| Petroleum Jelly | After 24 Hr | (missing) | (missing) |
| Moisturizer | Initial | 5 | 15.28 |
| Moisturizer | After 1 Hr | (missing) | (missing) |
| Moisturizer | After 24 Hr | (missing) | (missing) |
Step 3: Plotting the Graph
- For Height (mm):
- Plot three lines (one for each sample: Control, Petroleum Jelly, Moisturizer) with time on the x - axis and height on the y - axis.
- For the Control sample, the points are (Initial, 6), (After 1 Hr, 6), (After 24 Hr, 6). So it will be a horizontal line at \(y = 6\).
- For Petroleum Jelly, the initial height is 4. Since the other time - points' heights are missing, we can only plot the initial point (Initial, 4) for now.
- For Moisturizer, the initial height is 5. We can only plot the initial point (Initial, 5) for now.
- For Mass (g):
- Plot three lines (one for each sample: Control, Petroleum Jelly, Moisturizer) with time on the x - axis and mass on the y - axis.
- For the Control sample, the points are (Initial, 16.72), (After 1 Hr, 16.72), (After 24 Hr, 16.72). So it will be a horizontal line at \(y=16.72\).
- For Petroleum Jelly, the initial mass is 14.65. Since the other time - points' masses are missing, we can only plot the initial point (Initial, 14.65) for now.
- For Moisturizer, the initial mass is 15.28. We can only plot the initial point (Initial, 15.28) for now.
Step 4: Draw the Axes and Plot the Points
- Draw the x - axis and label it "Time (Initial, After 1 Hr, After 24 Hr)".
- Draw two y - axes (one for height and one for mass) and label them "Height (mm)" and "Mass (g)" respectively.
- Plot the points as described above and draw the lines (where data is available).
Since some of the data (after 1 hour and after 24 hours for Petroleum Jelly and Moisturizer) is missing, the graph will be partially complete with the available data points. If we assume that the experiment was intended to have complete data, we would need to fill in the missing values (either through actual measurement or by making assumptions based on the experimental design) to have a fully - fledged line graph.
If we were to present the graph with the available data, it would show the control sample having constant height and mass over time, while the Petroleum Jelly and Moisturizer samples have only their initial height and mass values plotted.