QUESTION IMAGE
Question
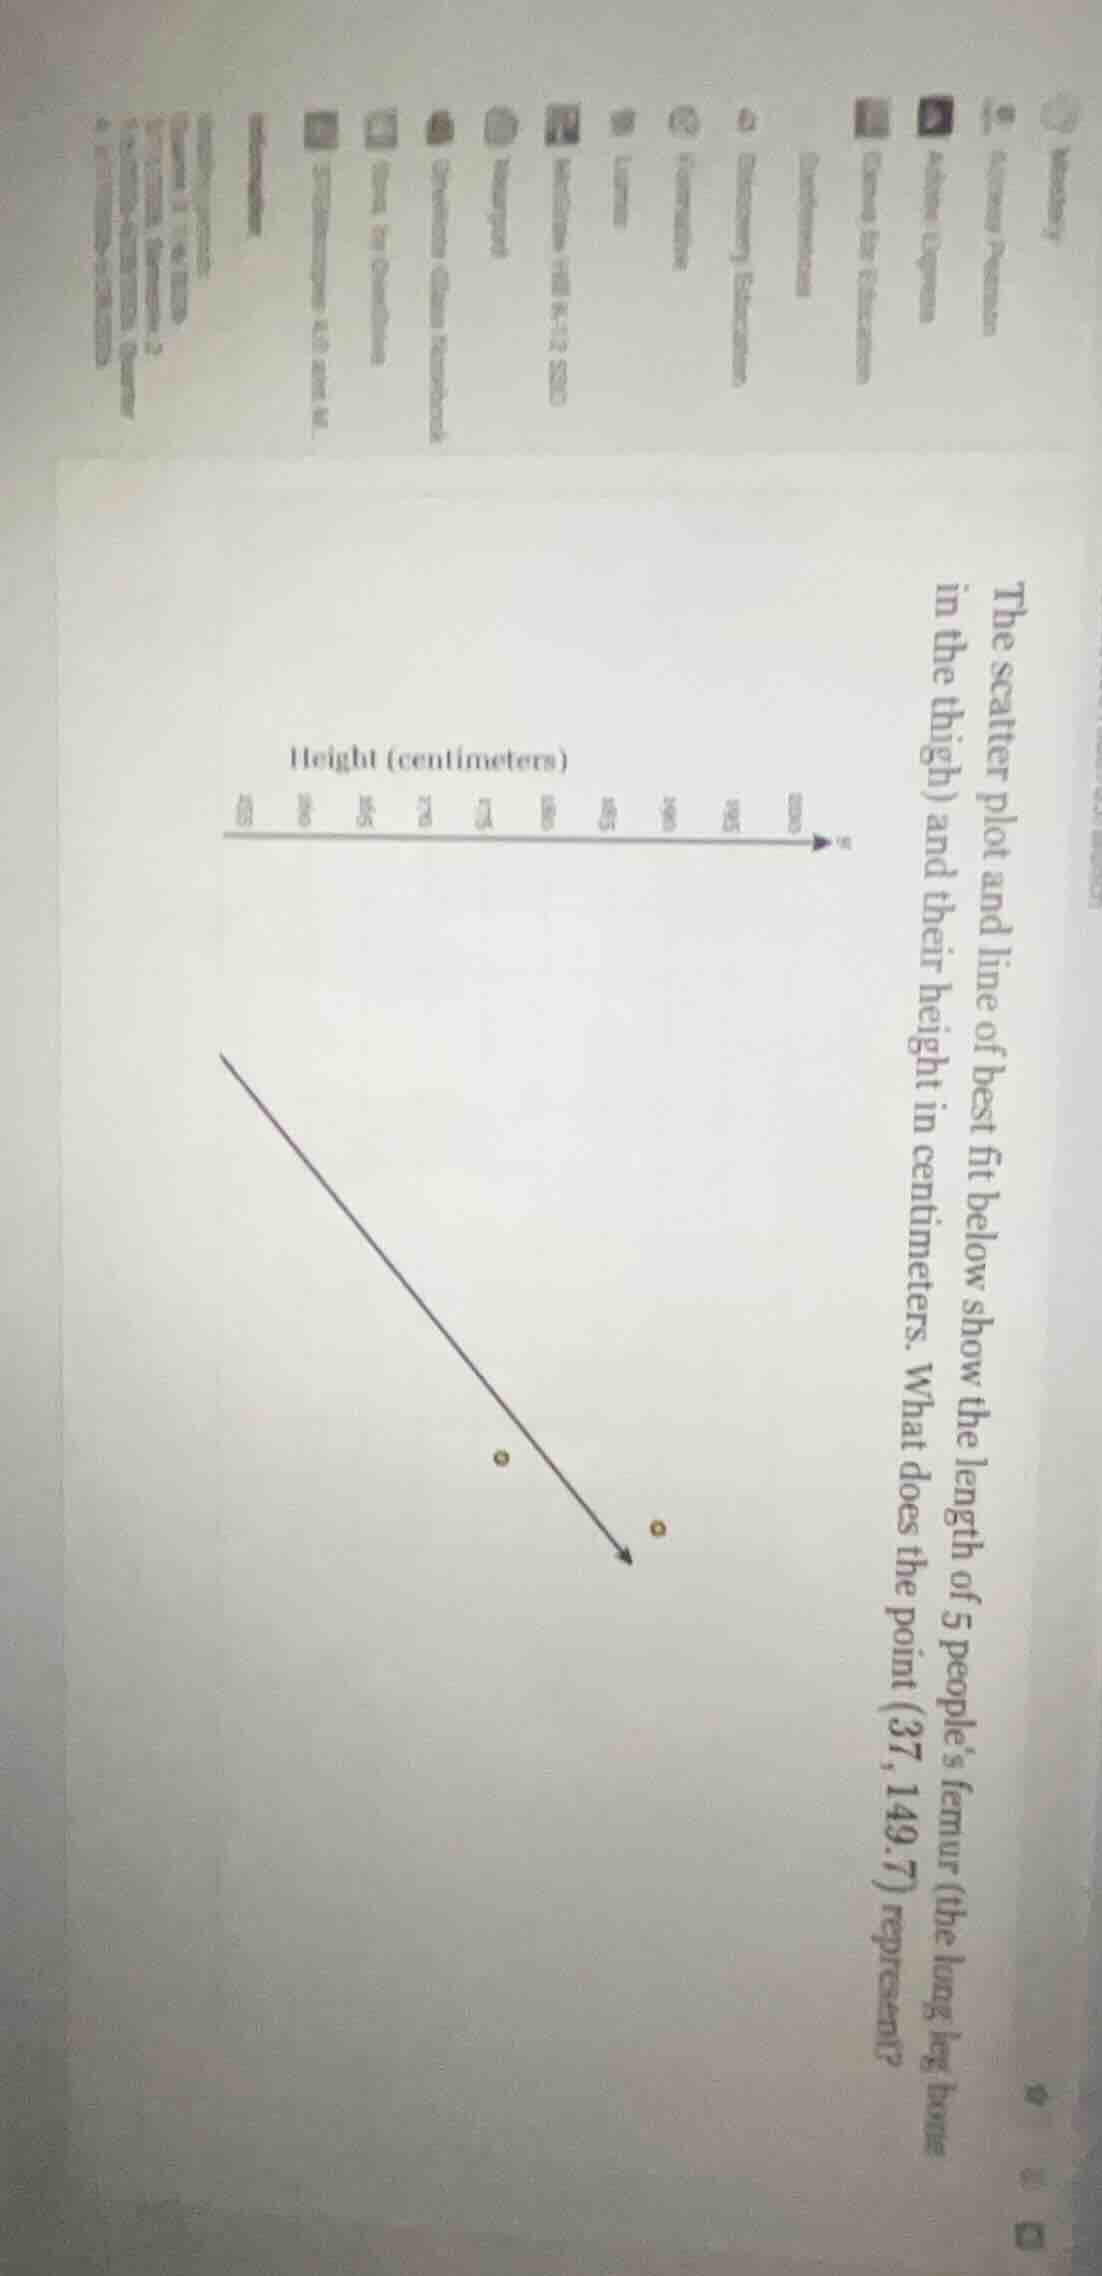
the scatter plot and line of best fit below show the length of 5 peoples femur (the long leg bone in the thigh) and their height in centimeters. what does the point (37, 149.7) represent?
Brief Explanations
In a scatter plot for this context, the first value in the ordered pair corresponds to the independent variable (femur length, the horizontal axis input), and the second value corresponds to the dependent variable (height, the vertical axis output).

Snap & solve any problem in the app
Get step-by-step solutions on Sovi AI
Photo-based solutions with guided steps
Explore more problems and detailed explanations
The point (37, 149.7) represents a person whose femur length is 37 centimeters and whose height is 149.7 centimeters.