QUESTION IMAGE
Question
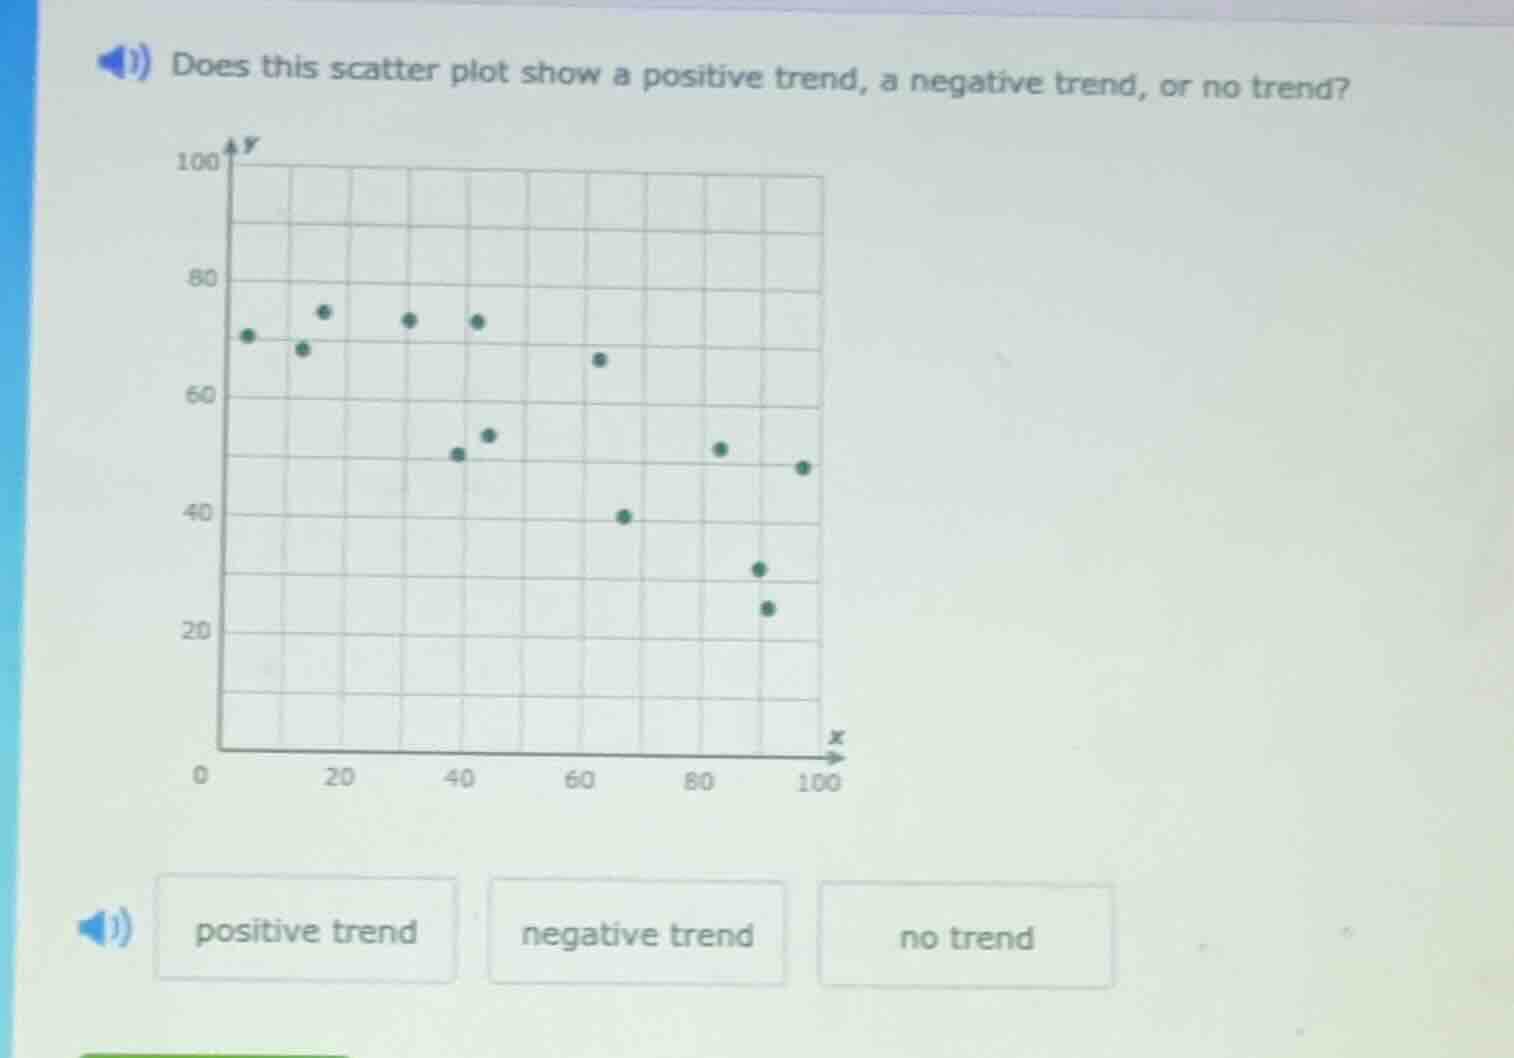
does this scatter plot show a positive trend, a negative trend, or no trend?
options: positive trend, negative trend, no trend
Step1: Analyze scatter plot trend
To determine the trend, we observe the general direction of the points as \( x \) (horizontal axis) increases. A positive trend means \( y \) (vertical axis) increases with \( x \), a negative trend means \( y \) decreases with \( x \), and no trend means no consistent direction.
Looking at the scatter plot, as \( x \) values (along the horizontal axis) increase from left to right, the \( y \) values (vertical axis) generally decrease. For example, when \( x \) is small (left side), \( y \) values are higher (e.g., around 60 - 80), and as \( x \) increases (moves right), \( y \) values become lower (e.g., around 20 - 50). This shows a negative relationship between \( x \) and \( y \), indicating a negative trend.

Snap & solve any problem in the app
Get step-by-step solutions on Sovi AI
Photo-based solutions with guided steps
Explore more problems and detailed explanations
negative trend