QUESTION IMAGE
Question
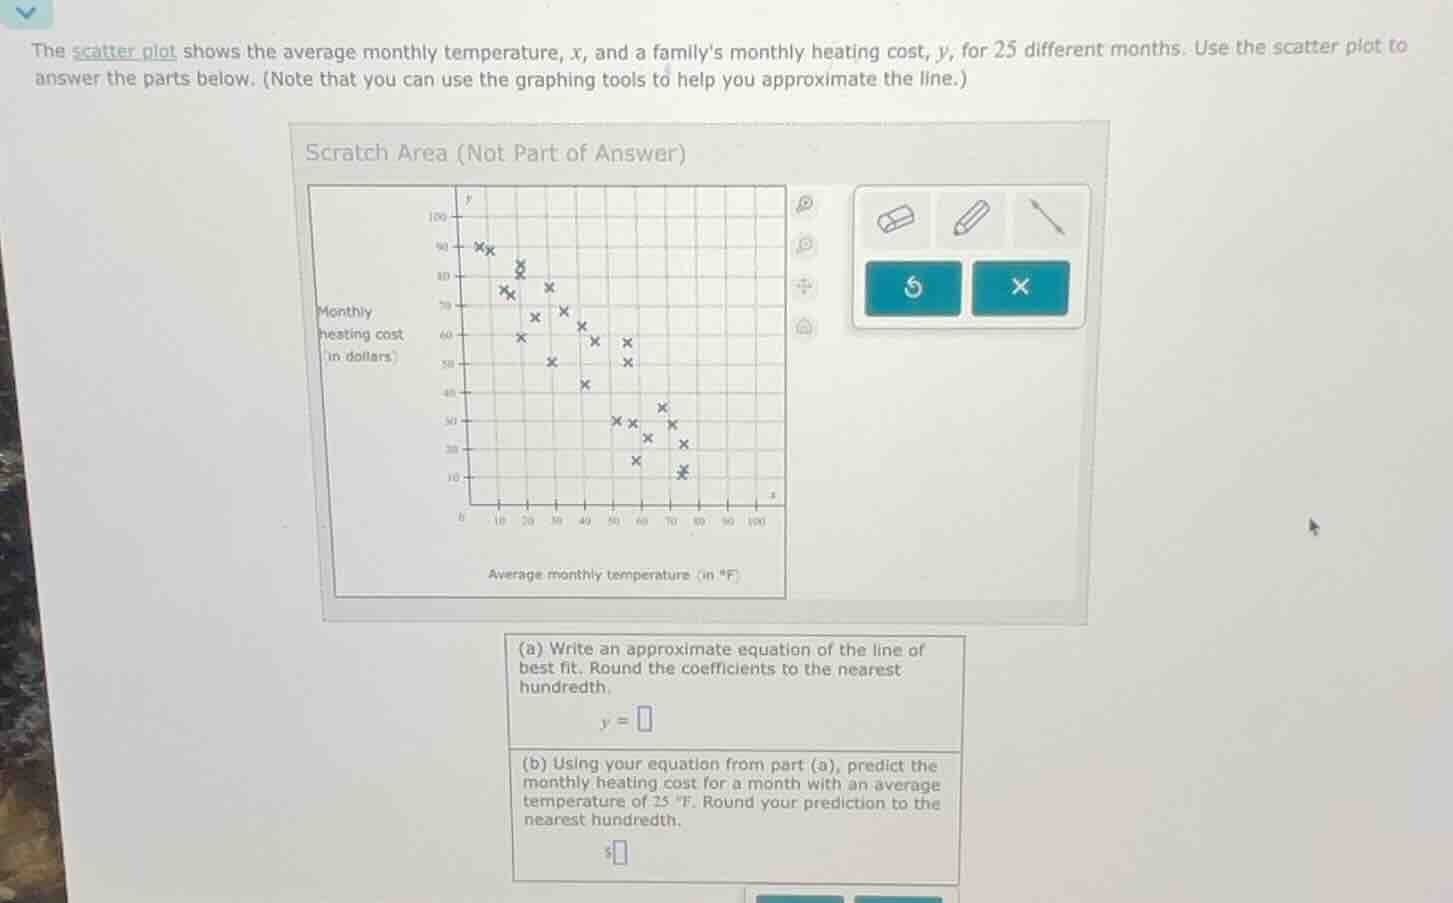
the scatter plot shows the average monthly temperature, x, and a familys monthly heating cost, y, for 25 different months. use the scatter plot to answer the parts below. (note that you can use the graphing tools to help you approximate the line.)
scratch area (not part of answer)
(a) write an approximate equation of the line of best fit. round the coefficients to the nearest hundredth.
y =
(b) using your equation from part (a), predict the monthly heating cost for a month with an average temperature of 25 °f. round your prediction to the nearest hundredth.
$
Step1: Identify two points on trend line
Choose points like $(10, 90)$ and $(70, 20)$ (approximate from scatter plot)
Step2: Calculate slope $m$
Slope formula: $m=\frac{y_2-y_1}{x_2-x_1}$
$m=\frac{20-90}{70-10}=\frac{-70}{60}\approx-1.17$
Step3: Find y-intercept $b$
Use $y=mx+b$ with $(10,90)$:
$90 = -1.17(10) + b$
$90 = -11.7 + b$
$b=90+11.7=101.70$
Step4: Write line of best fit
Combine slope and intercept: $y=-1.17x+101.70$
Step5: Predict cost at $x=25$
Substitute $x=25$ into the equation:
$y=-1.17(25)+101.70$
$y=-29.25+101.70=72.45$

Snap & solve any problem in the app
Get step-by-step solutions on Sovi AI
Photo-based solutions with guided steps
Explore more problems and detailed explanations
(a) $y = -1.17x + 101.70$
(b) $\$72.45$