QUESTION IMAGE
Question
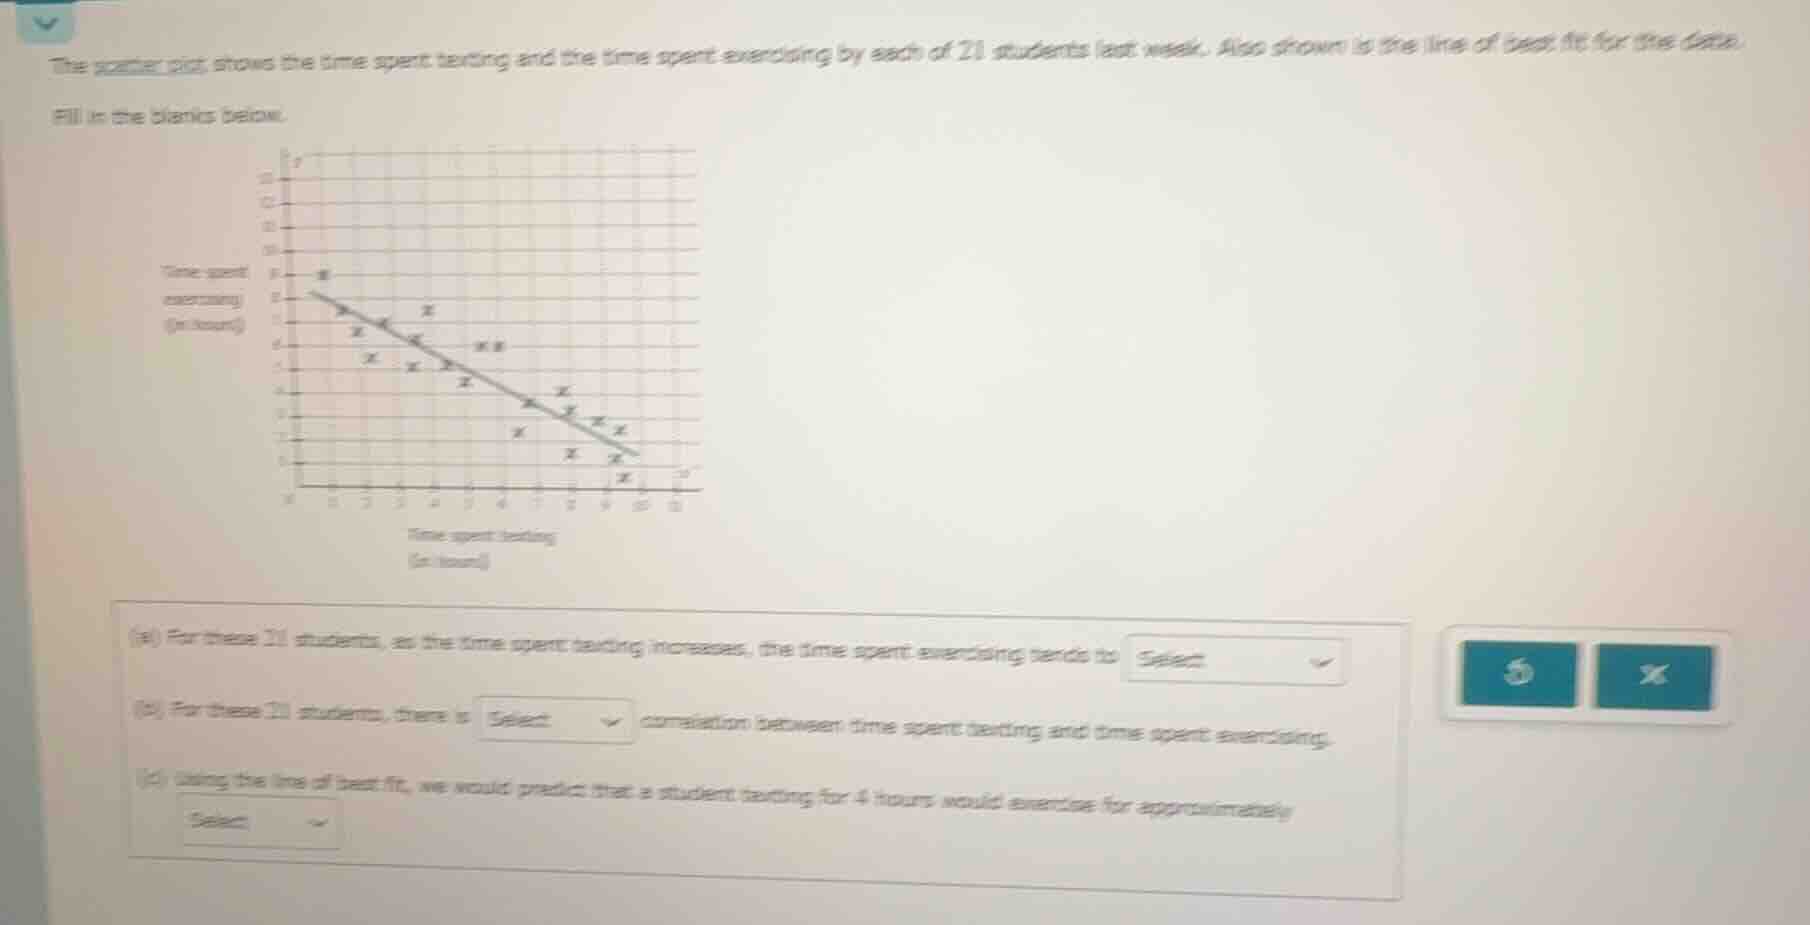
the scatter plot shows the time spent texting and the time spent exercising by each of 21 students last week. also shown is the line of best fit for the data.
fill in the blanks below.
(a) for these 21 students, as the time spent texting increases, the time spent exercising tends to select
(b) for these 21 students, there is select correlation between time spent texting and time spent exercising.
(c) using the line of best fit, we would predict that a student texting for 4 hours would exercise for approximately select
(a) The line of best fit slopes downward, meaning as x (texting time) increases, y (exercising time) goes down.
(b) A downward-sloping trend indicates an inverse relationship, which is a negative correlation.
(c) Locate x=4 on the horizontal axis, move up to the line of best fit, then left to the vertical axis; the value is approximately 5 hours.

Snap & solve any problem in the app
Get step-by-step solutions on Sovi AI
Photo-based solutions with guided steps
Explore more problems and detailed explanations
(a) decrease
(b) negative
(c) 5 hours