QUESTION IMAGE
Question
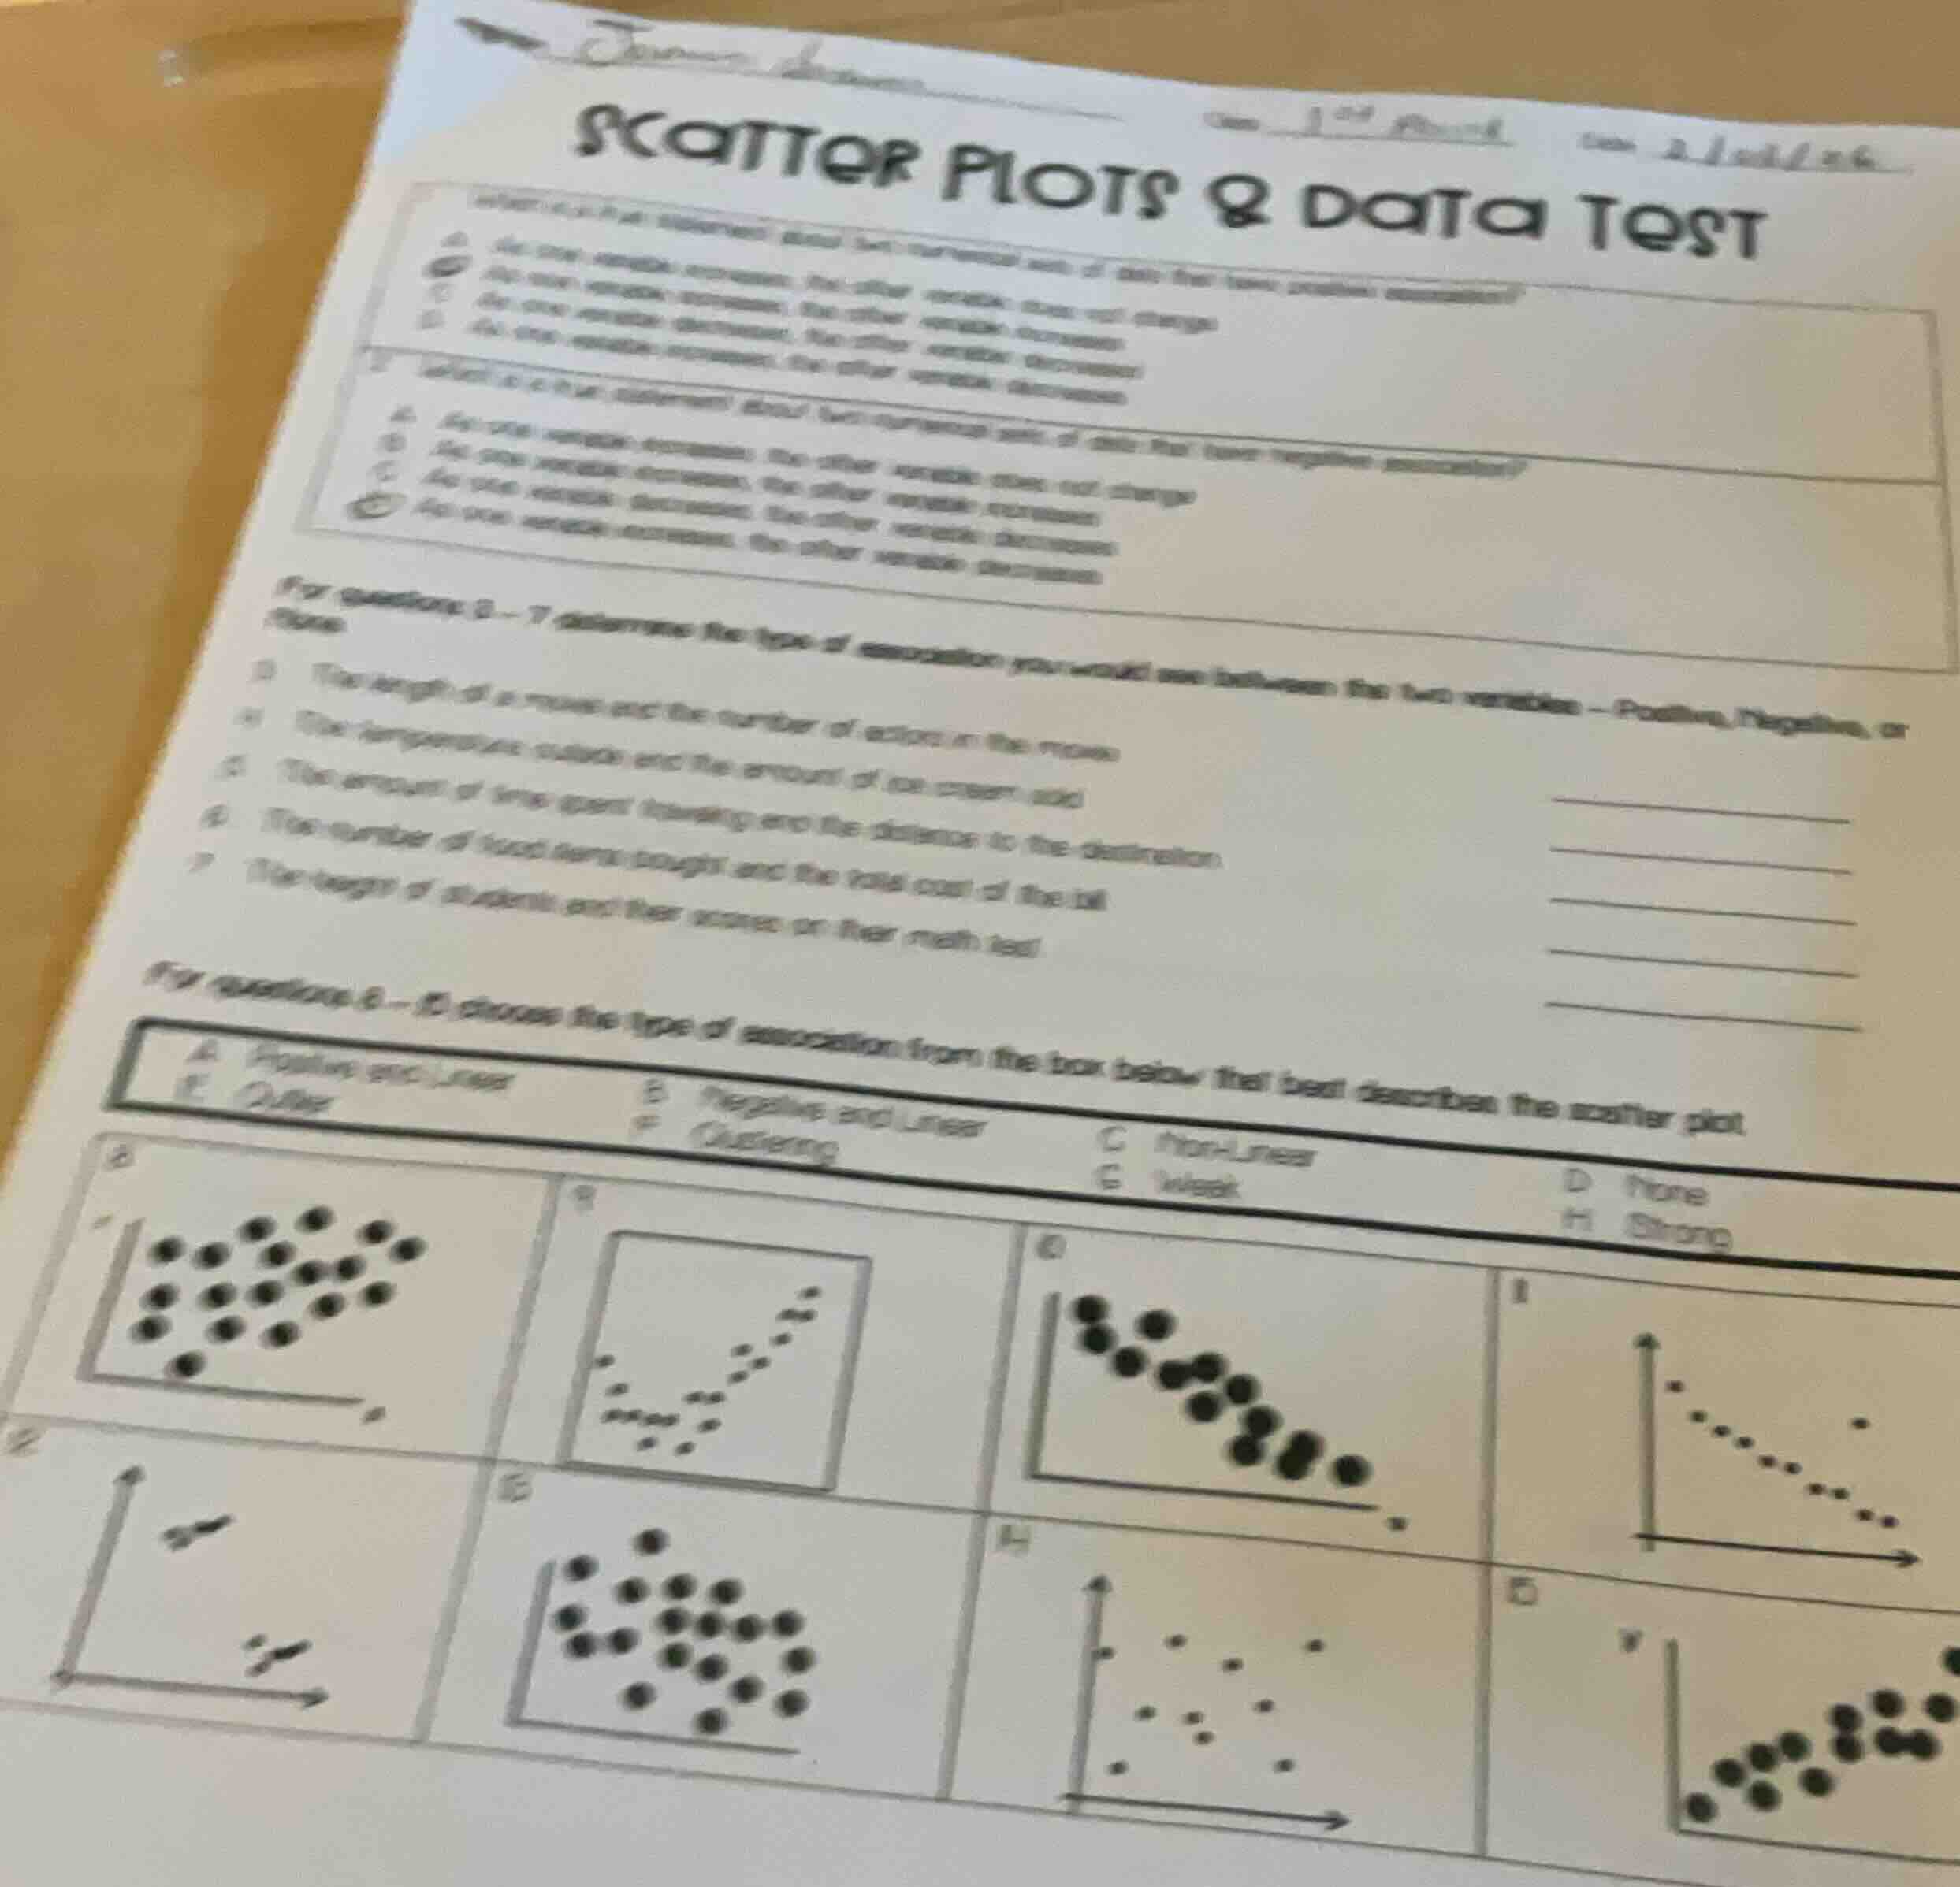
scatter plots & data test
first question (partially visible) about two numerical sets of data with positive association?
a. as one variable increases, the other variable does not change
b. as one variable increases, the other variable increases
c. as one variable decreases, the other variable increases
d. as one variable increases, the other variable decreases
second question (partially visible) about two numerical sets of data with negative association?
a. as one variable increases, the other variable does not change
b. as one variable increases, the other variable increases
c. as one variable decreases, the other variable increases
d. as one variable increases, the other variable decreases
for questions 3 – 7, determine the type of association you would see between the two variables – positive, negative, or none:
- the length of a movie and the number of actors in the movie
- the temperature outside and the amount of ice cream sold
- the amount of time spent traveling and the distance to the destination
- the number of food items bought and the total cost of the bill
- the height of students and their scores on their math test
for questions 8 – 15, choose the type of association from the box below that best describes the scatter plot.
a. positive and linear b. negative and linear c. non - linear d. none
e. outlier f. clustering g. weak h. strong
scatter plot diagrams for questions 8–15 (partially visible with plotted points)
Step1: Identify positive association
Positive association means as one variable increases, the other increases.
Step2: Identify negative association
Negative association means as one variable increases, the other decreases.
Step3: Classify Q1 (positive association)
Match definition to option: C. As one variable increases, the other variable increases
Step4: Classify Q2 (negative association)
Match definition to option: D. As one variable increases, the other variable decreases
Step5: Analyze Q3 (movie length & actors)
No consistent trend between the two variables.
Result: None
Step6: Analyze Q4 (temp & ice cream sold)
Higher temperature = more ice cream sold (positive trend).
Result: Positive
Step7: Analyze Q5 (travel time & distance)
Longer distance = more travel time (positive trend).
Result: Positive
Step8: Analyze Q6 (food items & total cost)
More items = higher total cost (positive trend).
Result: Positive
Step9: Analyze Q7 (height & math test score)
No consistent trend between the two variables.
Result: None
Step10: Classify Plot 8
Points show a clear upward linear trend.
Result: A. Positive and Linear
Step11: Classify Plot 9
Points form distinct grouped clusters.
Result: F. Clustering
Step12: Classify Plot 10
Points show a clear downward linear trend.
Result: B. Negative and Linear
Step13: Classify Plot 11
Points show a weak downward linear trend.
Result: B. Negative and Linear, G. Weak
Step14: Classify Plot 12
Points form two distinct grouped clusters.
Result: F. Clustering
Step15: Classify Plot 13
Points show a strong positive linear trend.
Result: A. Positive and Linear, H. Strong
Step16: Classify Plot 14
Points show no clear trend (weak/no association).
Result: G. Weak
Step17: Classify Plot 15
Points show a curved, non-linear upward trend.
Result: C. Non-Linear

Snap & solve any problem in the app
Get step-by-step solutions on Sovi AI
Photo-based solutions with guided steps
Explore more problems and detailed explanations
- C. As one variable increases, the other variable increases
- D. As one variable increases, the other variable decreases
- None
- Positive
- Positive
- Positive
- None
- A. Positive and Linear
- F. Clustering
- B. Negative and Linear
- B. Negative and Linear, G. Weak
- F. Clustering
- A. Positive and Linear, H. Strong
- G. Weak
- C. Non-Linear