QUESTION IMAGE
Question
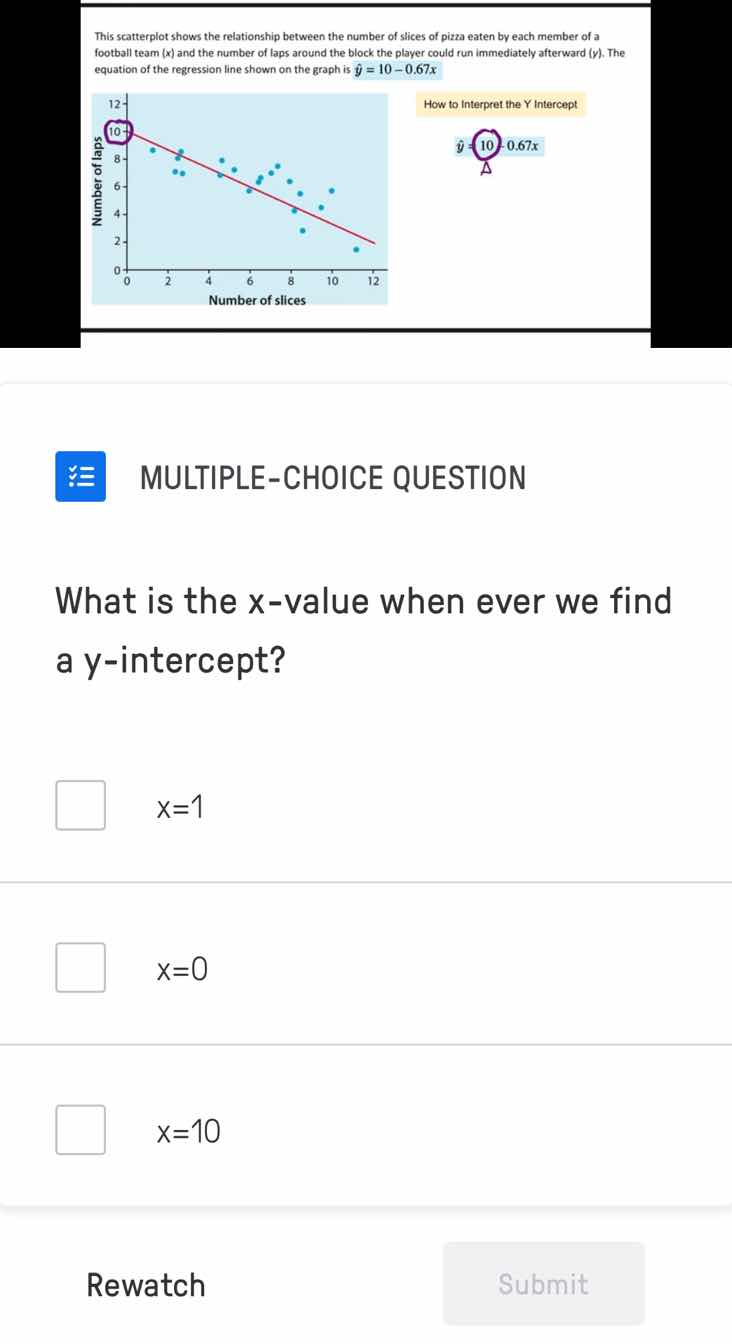
this scatterplot shows the relationship between the number of slices of pizza eaten by each member of a football team (x) and the number of laps around the block the player could run immediately afterward (y). the equation of the regression line shown on the graph is $hat{y}=10 - 0.67x$how to interpret the y intercept$hat{y}=10 - 0.67x$multiple-choice questionwhat is the x-value when ever we find a y-intercept?$x=1�LXB0�x=10$
The y-intercept of a line is the point where the line crosses the y-axis. By definition, this occurs when the x-value is 0, as the y-axis corresponds to x=0 on a coordinate plane.

Snap & solve any problem in the app
Get step-by-step solutions on Sovi AI
Photo-based solutions with guided steps
Explore more problems and detailed explanations
x=0