QUESTION IMAGE
Question
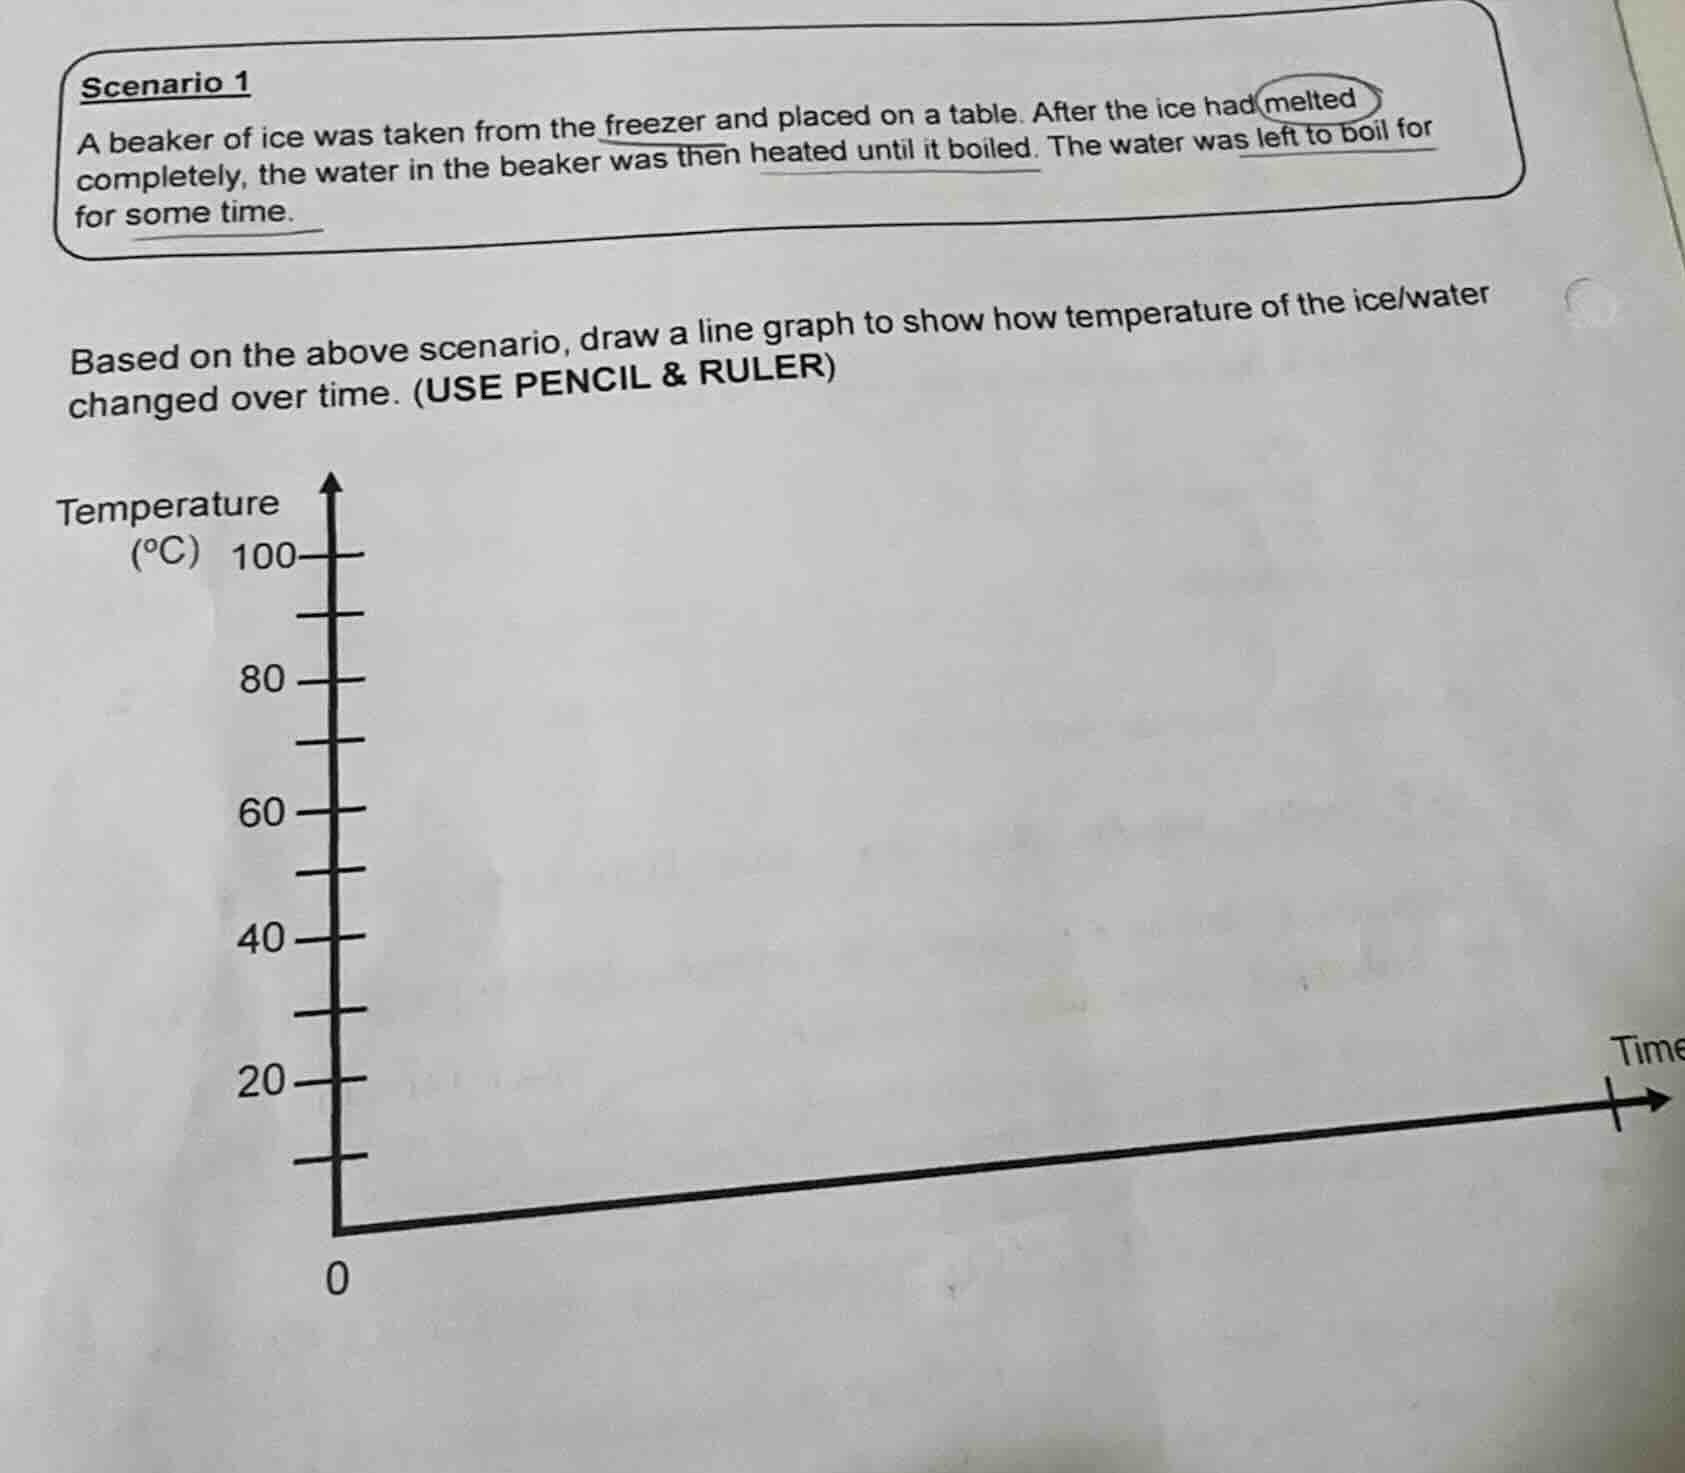
scenario 1
a beaker of ice was taken from the freezer and placed on a table. after the ice had melted completely, the water in the beaker was then heated until it boiled. the water was left to boil for some time.
based on the above scenario, draw a line graph to show how temperature of the ice/water changed over time. (use pencil & ruler)
temperature (°c) 100 80 60 40 20 0
time
Brief Explanations
- Stage 1 (Ice warming): The ice starts below 0°C (freezer temperature). As it sits on the table, its temperature rises linearly until it reaches 0°C.
- Stage 2 (Ice melting): At 0°C, the ice absorbs heat to melt into liquid water, so temperature stays constant (flat line) until all ice is melted.
- Stage 3 (Liquid water warming): Now liquid, the water's temperature rises linearly as it absorbs heat from the table, then from active heating, until it reaches 100°C.
- Stage 4 (Water boiling): At 100°C, the water absorbs heat to turn into steam, so temperature stays constant (flat line) while it boils for some time.

Snap & solve any problem in the app
Get step-by-step solutions on Sovi AI
Photo-based solutions with guided steps
Explore more problems and detailed explanations
The graph follows these key segments (plot in order along the time axis):
- A rising line from a starting point below 0°C up to 0°C.
- A horizontal flat line at 0°C (melting phase).
- A rising line from 0°C up to 100°C.
- A horizontal flat line at 100°C (boiling phase).
(When drawing, use a ruler to make straight, clean lines for each segment, and ensure the flat phases are perfectly horizontal.)