QUESTION IMAGE
Question
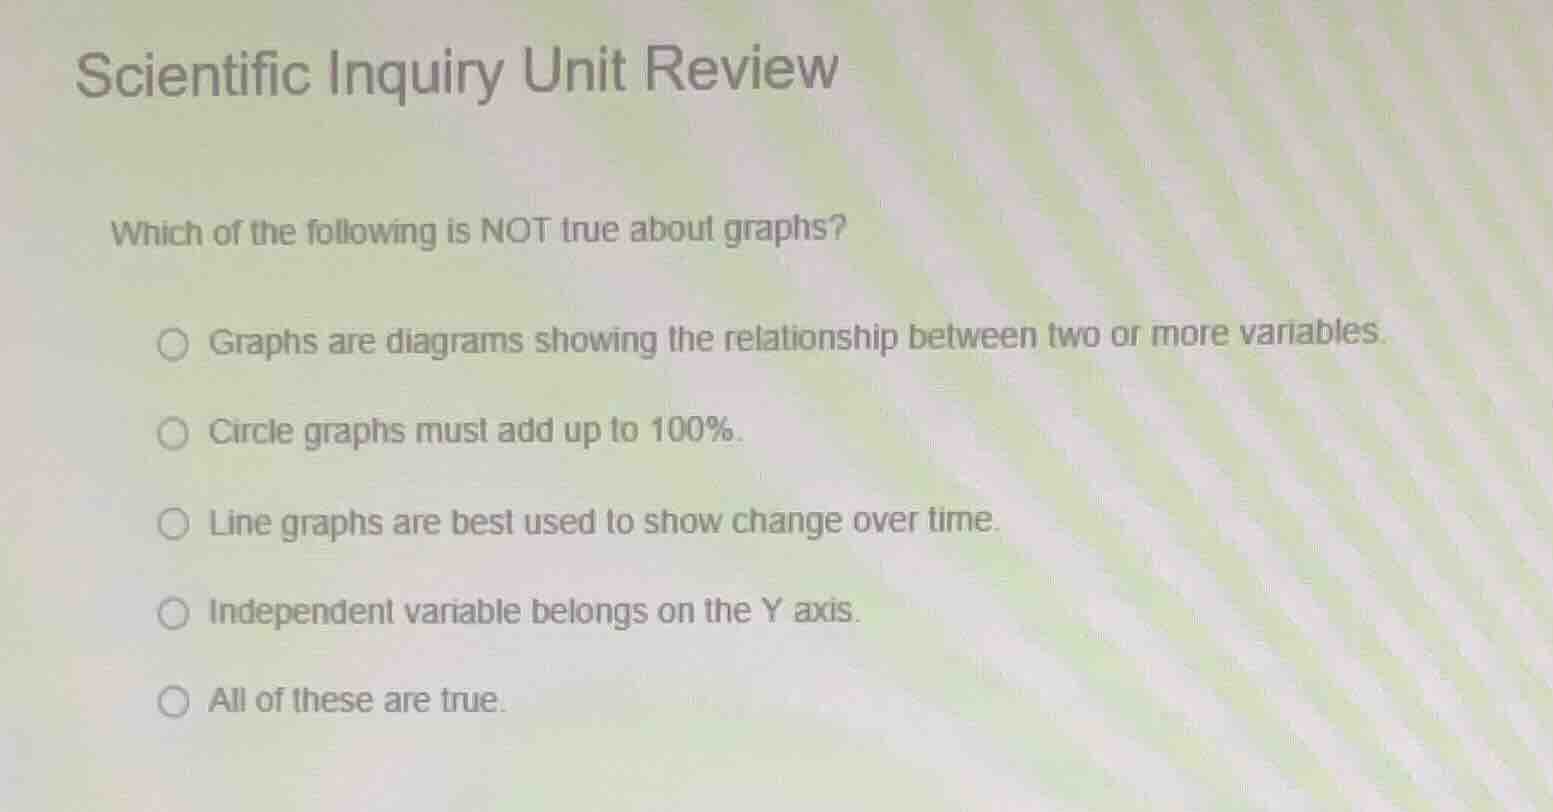
scientific inquiry unit review
which of the following is not true about graphs?
graphs are diagrams showing the relationship between two or more variables.
circle graphs must add up to 100%.
line graphs are best used to show change over time.
independent variable belongs on the y axis.
all of these are true.
Brief Explanations
- Graphs are defined as diagrams illustrating relationships between variables, so the first statement is true.
- Circle (pie) graphs represent proportions of a whole, so their sections must sum to 100%, making the second statement true.
- Line graphs are specifically designed to track trends and changes over a continuous period like time, so the third statement is true.
- In standard graphing conventions, the independent variable is placed on the X-axis, while the dependent variable goes on the Y-axis, so the fourth statement is false.

Snap & solve any problem in the app
Get step-by-step solutions on Sovi AI
Photo-based solutions with guided steps
Explore more problems and detailed explanations
Independent variable belongs on the Y axis.