QUESTION IMAGE
Question
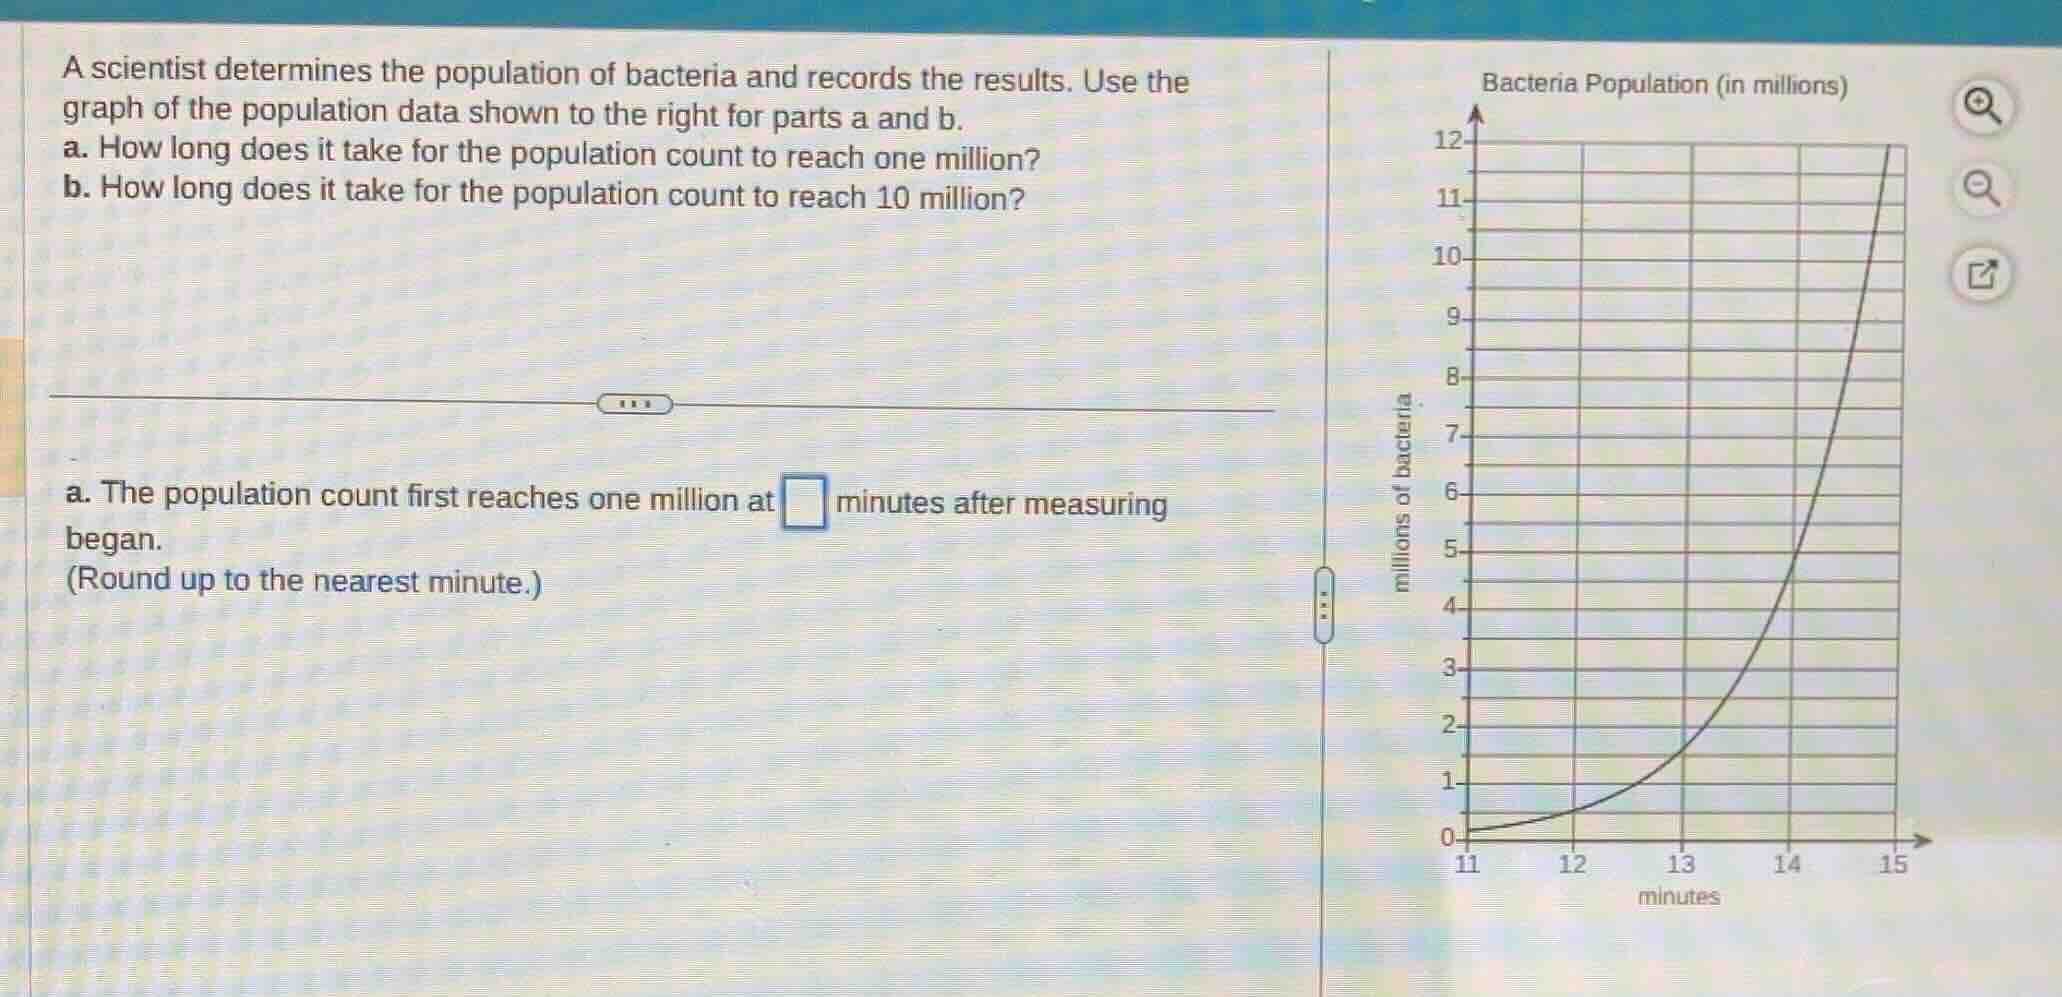
a scientist determines the population of bacteria and records the results. use the graph of the population data shown to the right for parts a and b. a. how long does it take for the population count to reach one million? b. how long does it take for the population count to reach 10 million? a. the population count first reaches one million at \\(\square\\) minutes after measuring began. (round up to the nearest minute.)
Part a
Step1: Identify the y - value
We need to find the time when the population (y - axis, in millions) is 1. So we look at the graph where \(y = 1\) (1 million bacteria).
Step2: Find the corresponding x - value
Looking at the graph, when \(y = 1\) (millions of bacteria), we check the x - axis (time in minutes). The x - value (time) corresponding to \(y = 1\) is around 12 minutes (by reading the graph: the curve passes through \(y = 1\) at \(x\approx12\) minutes when we round up to the nearest minute).
Step1: Identify the y - value
We need to find the time when the population (y - axis, in millions) is 10. So we look at the graph where \(y = 10\) (10 million bacteria).
Step2: Find the corresponding x - value
Looking at the graph, when \(y = 10\) (millions of bacteria), we check the x - axis (time in minutes). The x - value (time) corresponding to \(y = 10\) is around 15 minutes (by reading the graph: the curve passes through \(y = 10\) at \(x\approx15\) minutes).

Snap & solve any problem in the app
Get step-by-step solutions on Sovi AI
Photo-based solutions with guided steps
Explore more problems and detailed explanations
12