QUESTION IMAGE
Question
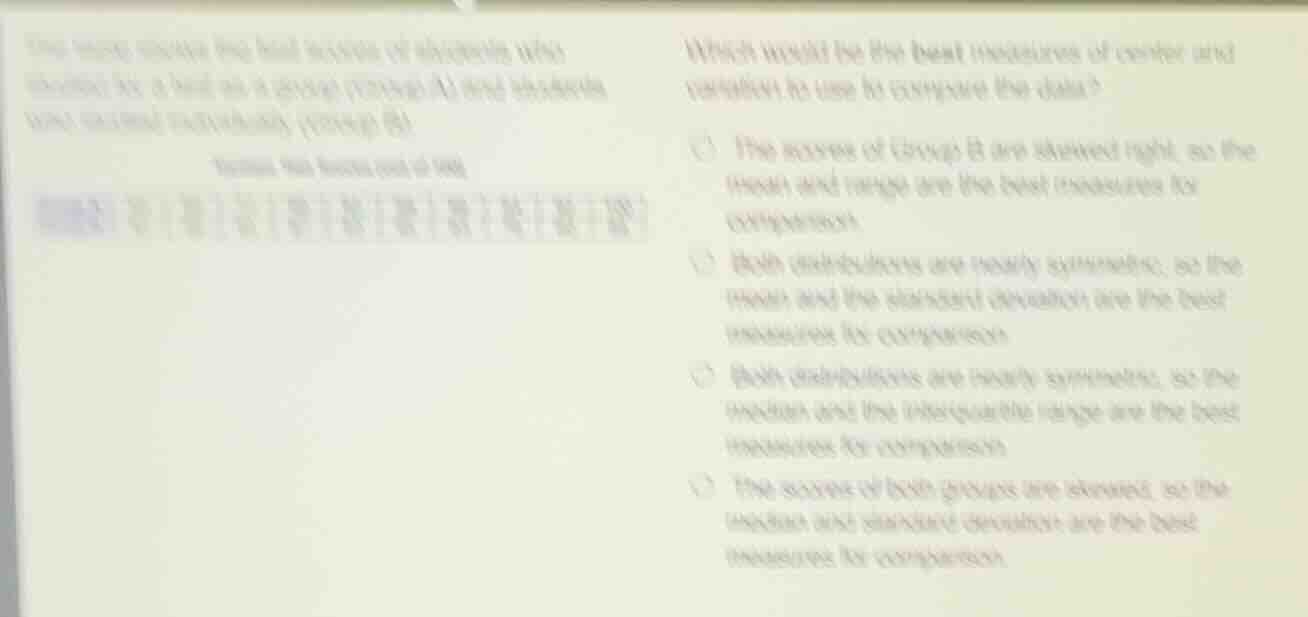
the scores (shown as big hall session) of students who studied for a test on a group (passage a) and students who studied individually (passage b)
scores (out of 100)
which would be the best measures of center and variation to use to compare the data?
- the scores of group b are skewed right, so the mean and range are the best measures for comparison.
- both distributions are nearly symmetric, so the mean and the standard deviation are the best measures for comparison.
- both distributions are nearly symmetric, so the median and the interquartile range are the best measures for comparison.
- the scores of both groups are skewed, so the median and standard deviation are the best measures for comparison.
To determine the best measures of center and variation, we analyze the distribution shape. When distributions are nearly symmetric (no strong skew), the mean (for center) and standard deviation (for variation) are appropriate because they use all data points. The median and interquartile range (IQR) are better for skewed data, while mean and range are not ideal (range is sensitive to outliers). Since the option states both distributions are nearly symmetric, mean (center) and standard deviation (variation) are the best.

Snap & solve any problem in the app
Get step-by-step solutions on Sovi AI
Photo-based solutions with guided steps
Explore more problems and detailed explanations
B. Both distributions are nearly symmetric, so the mean and the standard deviation are the best measures for comparison