QUESTION IMAGE
Question
select all the correct answers.
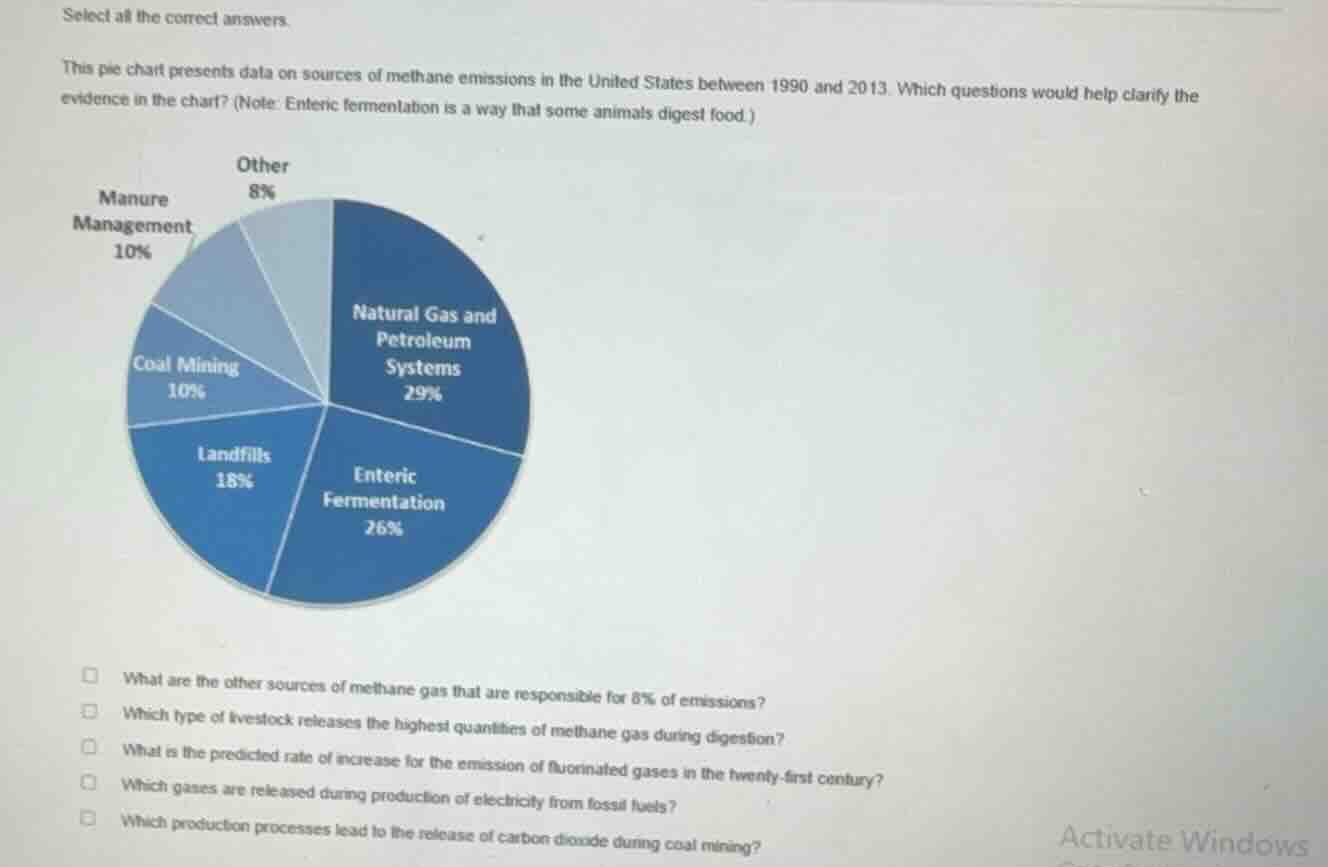
this pie chart presents data on sources of methane emissions in the united states between 1990 and 2013. which questions would help clarify the evidence in the chart? (note: enteric fermentation is a way that some animals digest food.)
what are the other sources of methane gas that are responsible for 8% of emissions?
which type of livestock releases the highest quantities of methane gas during digestion?
what is the predicted rate of increase for the emission of fluorinated gases in the twenty-first century?
which gases are released during production of electricity from fossil fuels?
which production processes lead to the release of carbon dioxide during coal mining?
- The first question clarifies the vague "Other" category in the pie chart, which directly relates to the data presented.
- The second question provides more detail about the "Enteric Fermentation" category (noted as animal digestion), helping to clarify this specific emission source from the chart.
- The third, fourth, and fifth questions focus on gases or topics (fluorinated gases, carbon dioxide, electricity production gases) not addressed by the methane emissions pie chart, so they do not clarify the given evidence.

Snap & solve any problem in the app
Get step-by-step solutions on Sovi AI
Photo-based solutions with guided steps
Explore more problems and detailed explanations
- What are the other sources of methane gas that are responsible for 8% of emissions?
- Which type of livestock releases the highest quantities of methane gas during digestion?