QUESTION IMAGE
Question
4 select all designs which describe an experimental study
a. 100 randomly selected students are asked if they have their driver’s license
b. 50 baseball players are selected to wear compression sleeves during practice and games and another 50 players are selected not to wear compression sleeves during practice and games. the number of visits to the athletic trainer is recorded for each group.
c. 50 athletes are asked if they stretch before practice. a different group of 50 athletes are asked if they drink more than 2 quarts of water on days they have practice. the results are recorded for both groups
d. 100 students taking chemistry are randomly selected. 50 of the students have their arm length and wrist circumference measured. the other 50 students have their foot length and head circumference measured. the ratio of arm length to wrist circumference and foot length to head circumference are recorded
e. 50 students volunteer to drink 2 quarts of water each day for a week. another 50 students volunteer to drink 2 quarts of a sports drink each day for a week. each day students record the number of hours they sleep.
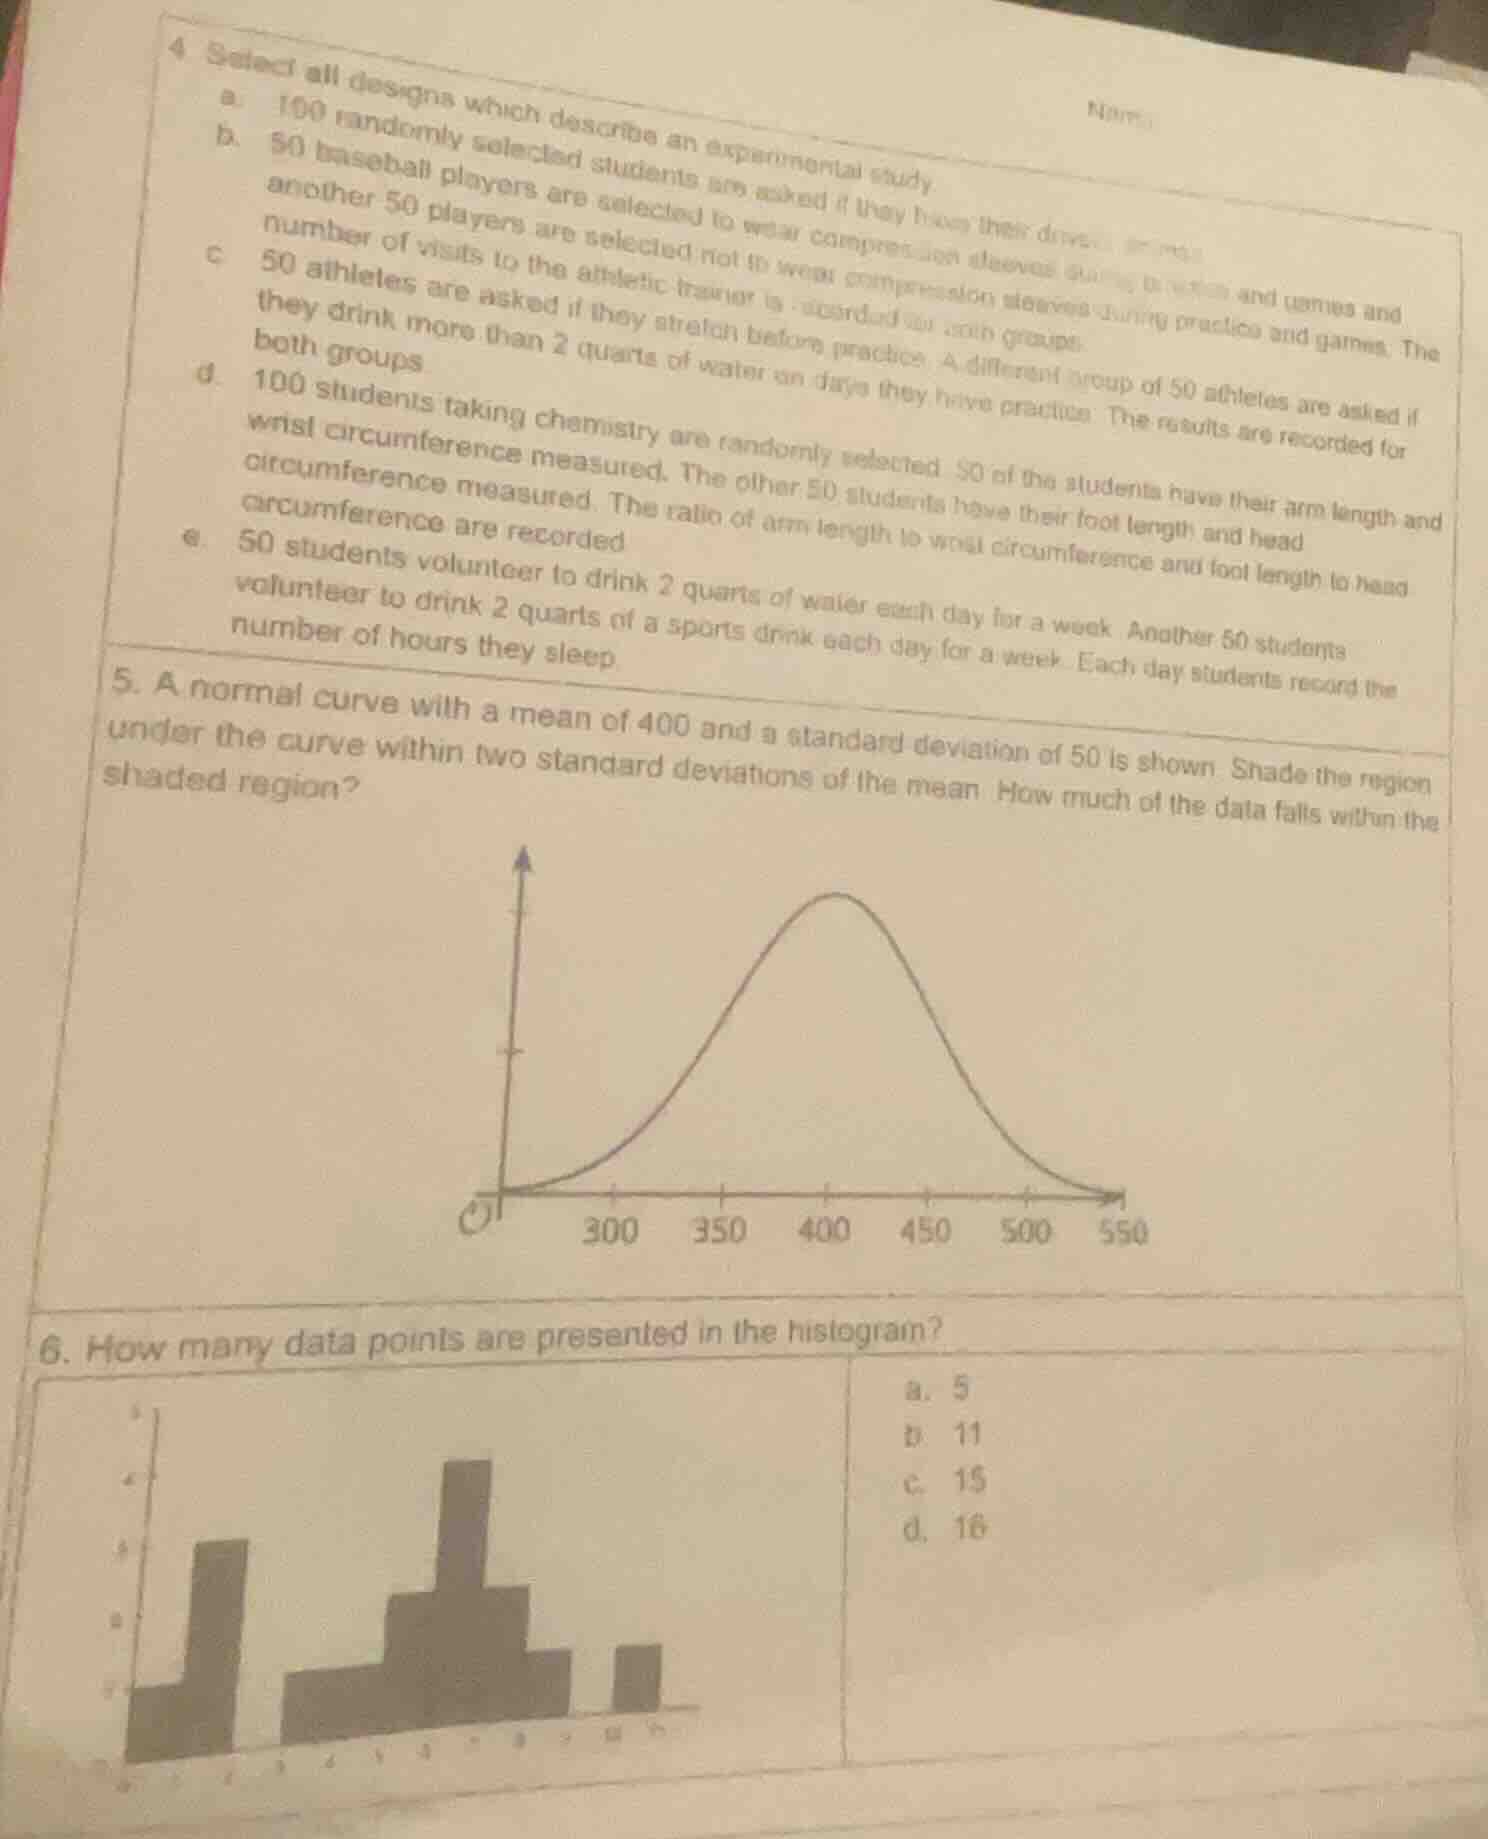
- a normal curve with a mean of 400 and a standard deviation of 50 is shown. shade the region under the curve within two standard deviations of the mean. how much of the data falls within the shaded region?
image of a normal distribution curve with x - axis labeled 300, 350, 400, 450, 500, 550
- how many data points are presented in the histogram?
image of a histogram
a. 5
b. 11
c. 15
d. 16
---
Question 4
Step1: Identify experimental study traits
An experimental study involves manipulating a variable (treatment) and comparing outcomes between groups.
Step2: Evaluate each option
- a: Observational (only surveying, no manipulation)
- b: Manipulates sleeve use, compares trainer visits (experimental)
- c: Observational (surveying two separate groups, no manipulation)
- d: Observational (measuring ratios, no treatment)
- e: Manipulates drink type, compares sleep hours (experimental)
---
Question 5
Step1: Recall empirical rule
For normal distributions, the empirical rule states:
Step2: Apply 2 standard deviations rule
Within $\mu \pm 2\sigma$, 95% of data falls here.
Given $\mu=400$, $\sigma=50$: $400\pm2(50) = 300$ to $500$. 95% of data lies in this range.
---
Question 6
Step1: Sum histogram bar heights
Add the values of each bar: $1+3+2+4+1+2+1+2$
Step2: Calculate total

Snap & solve any problem in the app
Get step-by-step solutions on Sovi AI
Photo-based solutions with guided steps
Explore more problems and detailed explanations
Question 4:
b. 50 baseball players are selected to wear compression sleeves during practice and games and another 50 players are selected not to wear compression sleeves during practice and games. The number of visits to the athletic trainer is recorded for both groups.
e. 50 students volunteer to drink 2 quarts of water each day for a week. Another 50 students volunteer to drink 2 quarts of a sports drink each day for a week. Each day students record the number of hours they sleep.
Question 5:
95%
Question 6:
d. 16