QUESTION IMAGE
Question
1
select the correct answer from each drop-down menu.
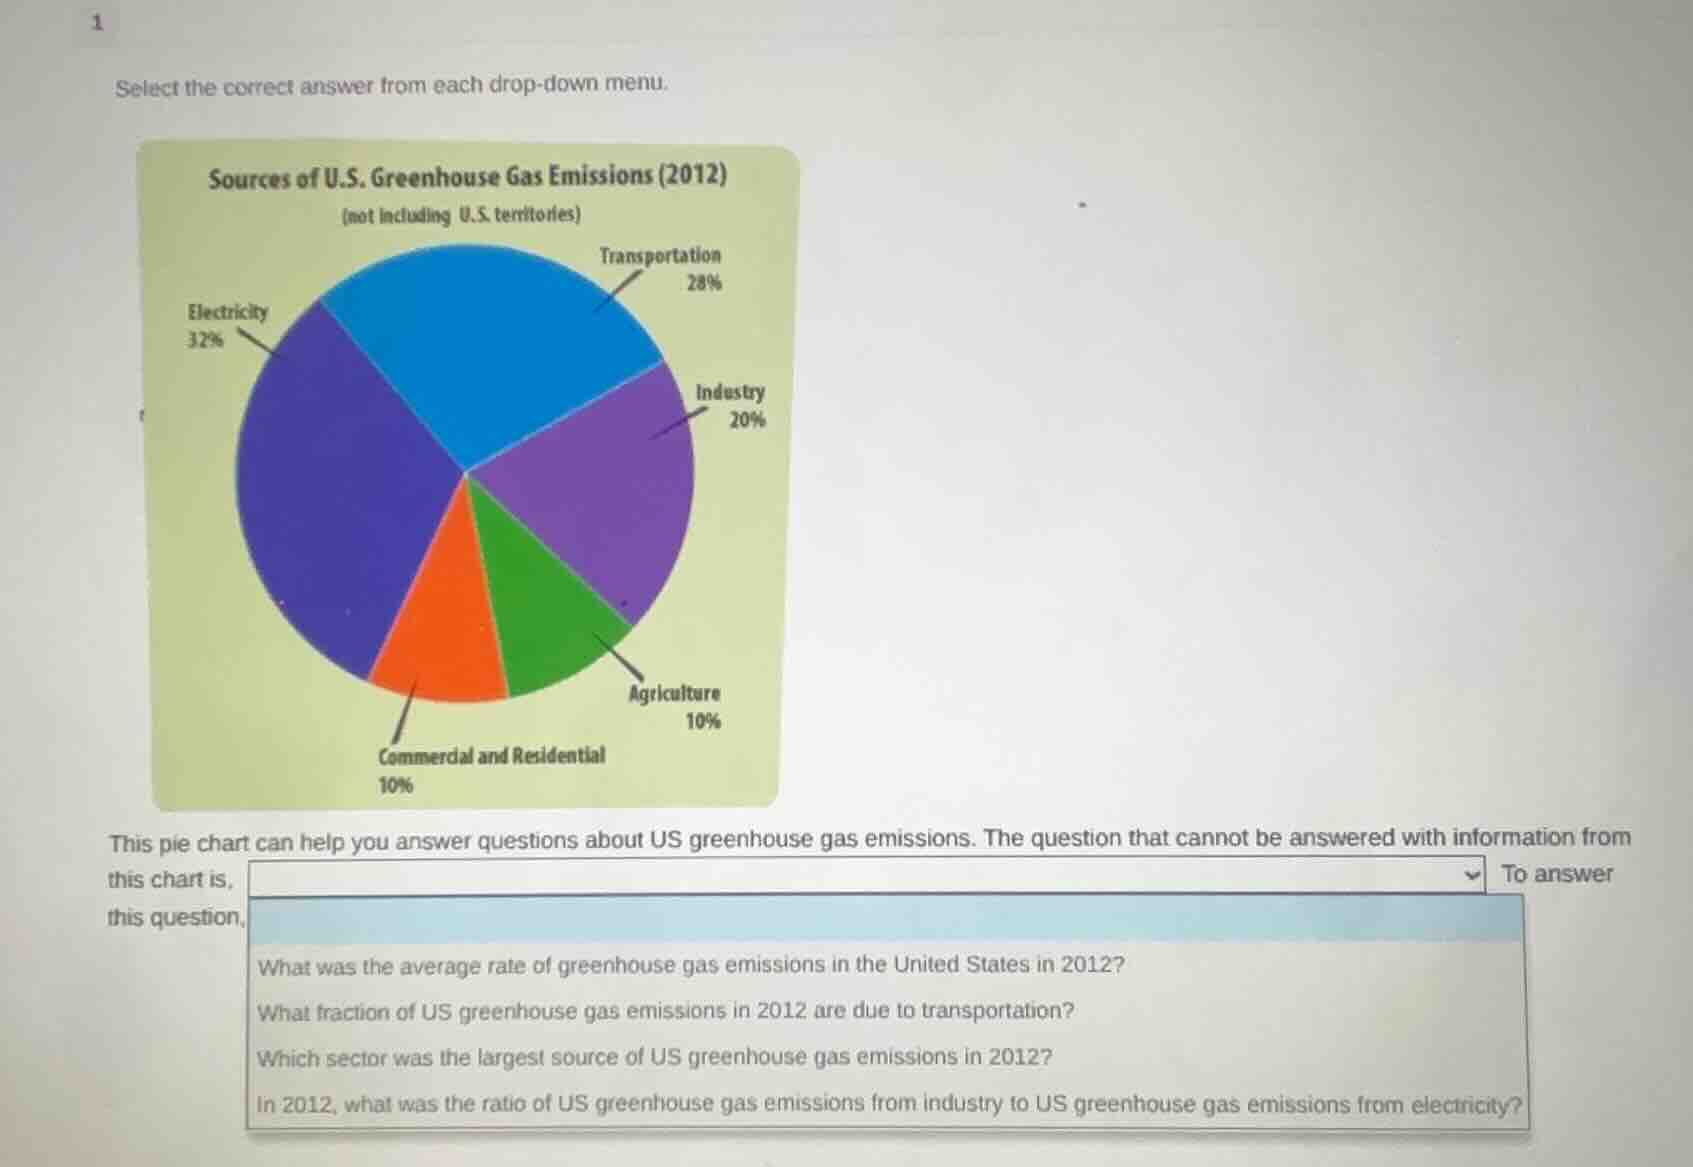
sources of u.s. greenhouse gas emissions (2012)
(not including u.s. territories)
electricity 32%
transportation 28%
industry 20%
agriculture 10%
commercial and residential 10%
this pie chart can help you answer questions about us greenhouse gas emissions. the question that cannot be answered with information from this chart is.
to answer this question,
what was the average rate of greenhouse gas emissions in the united states in 2012?
what fraction of us greenhouse gas emissions in 2012 are due to transportation?
which sector was the largest source of us greenhouse gas emissions in 2012?
in 2012, what was the ratio of us greenhouse gas emissions from industry to us greenhouse gas emissions from electricity?
- The pie chart only provides percentage breakdowns of greenhouse gas emission sources, not actual total emission amounts or rates.
- "What fraction of US greenhouse gas emissions in 2012 are due to transportation?" can be answered: transportation is 28%, which is $\frac{7}{25}$.
- "Which sector was the largest source of US greenhouse gas emissions in 2012?" can be answered: Electricity (32%, the highest percentage).
- "In 2012, what was the ratio of US greenhouse gas emissions from industry to US greenhouse gas emissions from electricity?" can be answered: $\frac{20\%}{32\%} = \frac{5}{8}$.
- "What was the average rate of greenhouse gas emissions in the United States in 2012?" cannot be answered, as the chart does not provide total emission volume or time-based rate data.

Snap & solve any problem in the app
Get step-by-step solutions on Sovi AI
Photo-based solutions with guided steps
Explore more problems and detailed explanations
What was the average rate of greenhouse gas emissions in the United States in 2012?