QUESTION IMAGE
Question
select the correct answer.
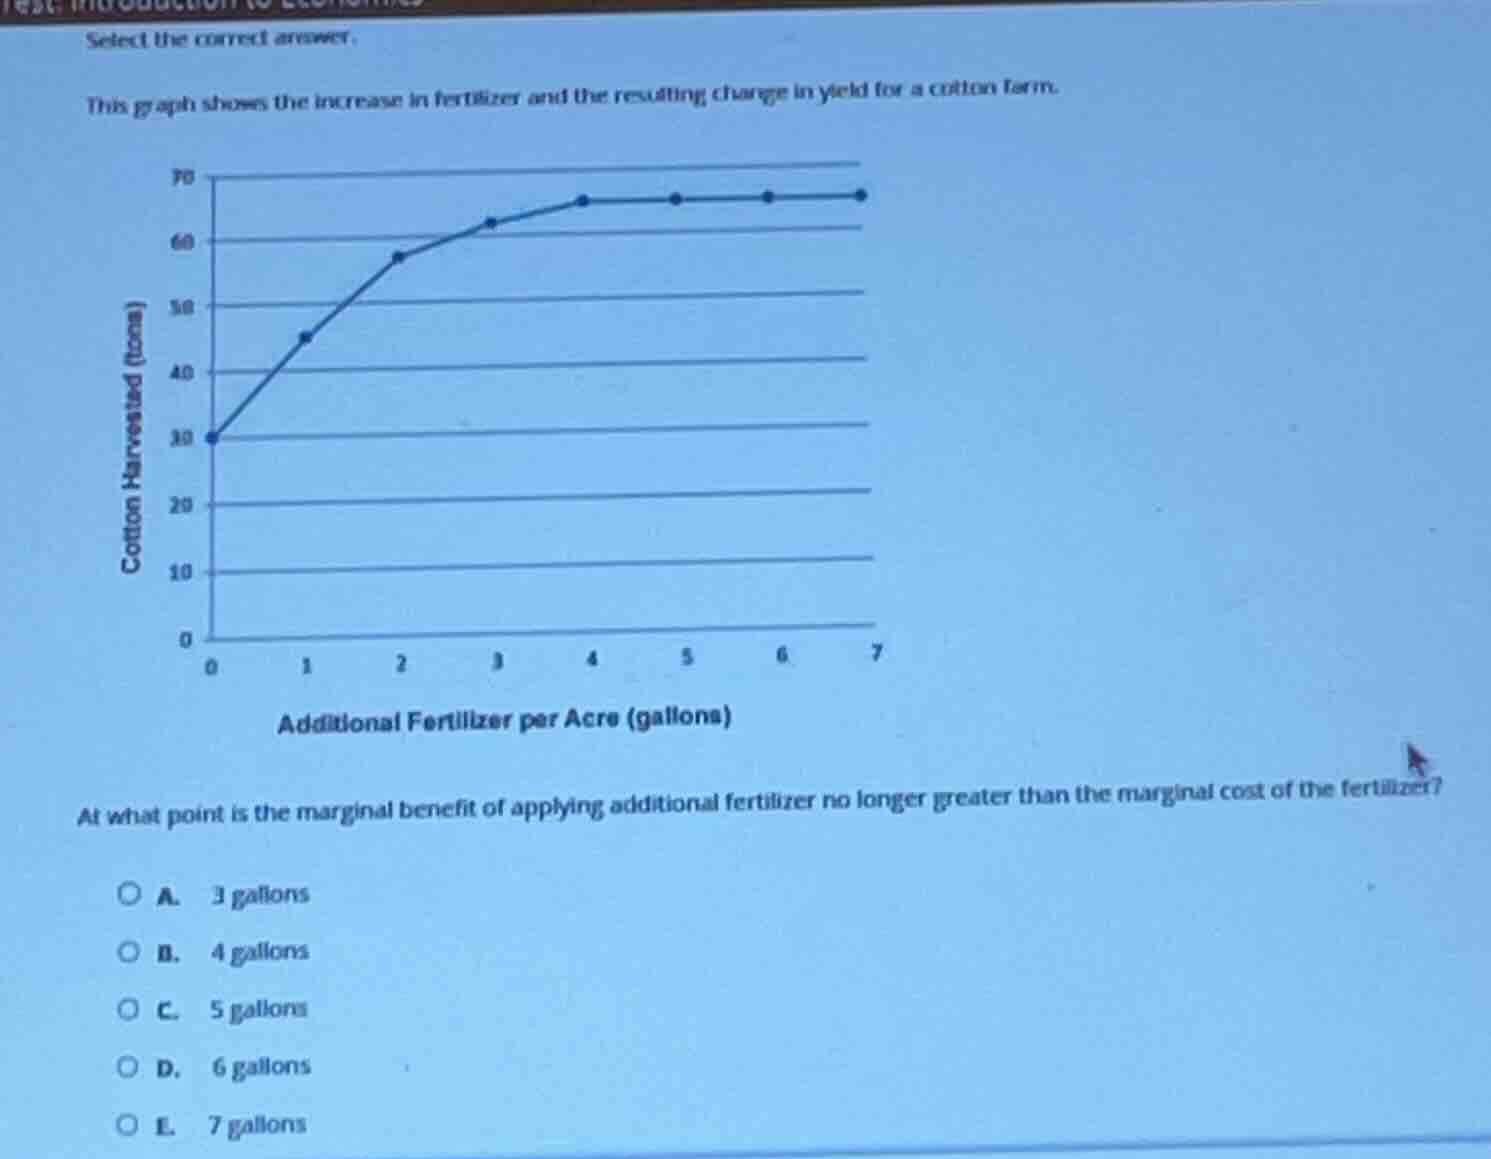
this graph shows the increase in fertilizer and the resulting change in yield for a cotton farm.
at what point is the marginal benefit of applying additional fertilizer no longer greater than the marginal cost of the fertilizer?
a. 3 gallons
b. 4 gallons
c. 5 gallons
d. 6 gallons
e. 7 gallons
Step1: Understand Marginal Benefit
Marginal benefit is the additional yield from each gallon of fertilizer. We check when the yield increase (marginal benefit) stops increasing or becomes zero (since after that, adding fertilizer won't increase yield, so marginal benefit ≤ marginal cost).
Step2: Analyze the Graph
- At 0 gallons: Yield = 30 tons.
- At 1 gallon: Yield ≈ 45 tons (increase = 15).
- At 2 gallons: Yield ≈ 58 tons (increase = 13).
- At 3 gallons: Yield ≈ 63 tons (increase = 5).
- At 4 gallons: Yield ≈ 66 tons (increase = 3).
- At 5 gallons: Yield = 66 tons (increase = 0).
Wait, no, wait the graph: Wait, the x-axis is 0 - 7, y-axis cotton harvested. Let's re - check the points:
Wait, the first segment (0 to 1): from (0,30) to (1,45) (increase 15).
1 to 2: (1,45) to (2,58) (increase 13).
2 to 3: (2,58) to (3,63) (increase 5).
3 to 4: (3,63) to (4,66) (increase 3).
4 to 5: (4,66) to (5,66) (increase 0). Wait, no, the graph at x = 4,5,6,7 the y - value is the same (around 66 - 67). Wait, maybe I misread. Wait the graph: at x = 0, y = 30; x = 1, y = 45; x = 2, y = 58; x = 3, y = 63; x = 4, y = 66; x = 5, y = 66; x = 6, y = 66; x = 7, y = 66.
So marginal benefit (change in y per change in x) from x = 0 to 1: 45 - 30 = 15.
x = 1 to 2: 58 - 45 = 13.
x = 2 to 3: 63 - 58 = 5.
x = 3 to 4: 66 - 63 = 3.
x = 4 to 5: 66 - 66 = 0.
So when marginal benefit becomes 0 (or less than marginal cost), it's when the yield stops increasing. So at x = 4, after that (x = 5,6,7), the yield doesn't increase. Wait, but the options are 3,4,5,6,7. Wait, maybe the question is when marginal benefit is no longer greater than marginal cost. So when the marginal benefit (additional yield) is zero or less, then it's not greater than marginal cost. So at x = 4, the marginal benefit from 3 to 4 is 3, from 4 to 5 is 0. Wait, maybe the graph is a bit different. Wait, maybe the key is that after 4 gallons, the yield stops increasing (marginal benefit = 0). So the point where marginal benefit is no longer greater than marginal cost is when we add the 4th gallon? Wait, no, let's think again. The marginal benefit of applying the nth gallon is the increase in yield from (n - 1) to n gallons.
For n = 1: benefit = 45 - 30 = 15.
n = 2: 58 - 45 = 13.
n = 3: 63 - 58 = 5.
n = 4: 66 - 63 = 3.
n = 5: 66 - 66 = 0.
So when n = 5 (applying the 5th gallon), the marginal benefit is 0, which is not greater than marginal cost (assuming marginal cost is positive). So the point is when we apply the 5th gallon? Wait, no, the x - axis is "Additional Fertilizer per Acre (gallons)". So at x = 4, we have applied 4 gallons, and the next gallon (x = 5) gives no benefit. So the point where marginal benefit is no longer greater than marginal cost is at 5 gallons? Wait, but let's check the options. Option C is 5 gallons. Wait, maybe my initial analysis was wrong. Let's see the graph again. The line from x = 4 to x = 7 is flat. So the marginal benefit of going from 4 to 5 gallons is 0. So if marginal cost is, say, positive, then 0 (marginal benefit) is not greater than marginal cost. So the point is at 5 gallons? Wait, but let's check the options. The options are A.3, B.4, C.5, D.6, E.7.
Wait, maybe the key is that before x = 4, the yield is still increasing (marginal benefit positive), and at x = 4, the next gallon (x = 5) has marginal benefit 0. So the point when marginal benefit is no longer greater than marginal cost is when we apply the 5th gallon (x = 5). So the answer is C.5 gallons.

Snap & solve any problem in the app
Get step-by-step solutions on Sovi AI
Photo-based solutions with guided steps
Explore more problems and detailed explanations
C. 5 gallons