QUESTION IMAGE
Question
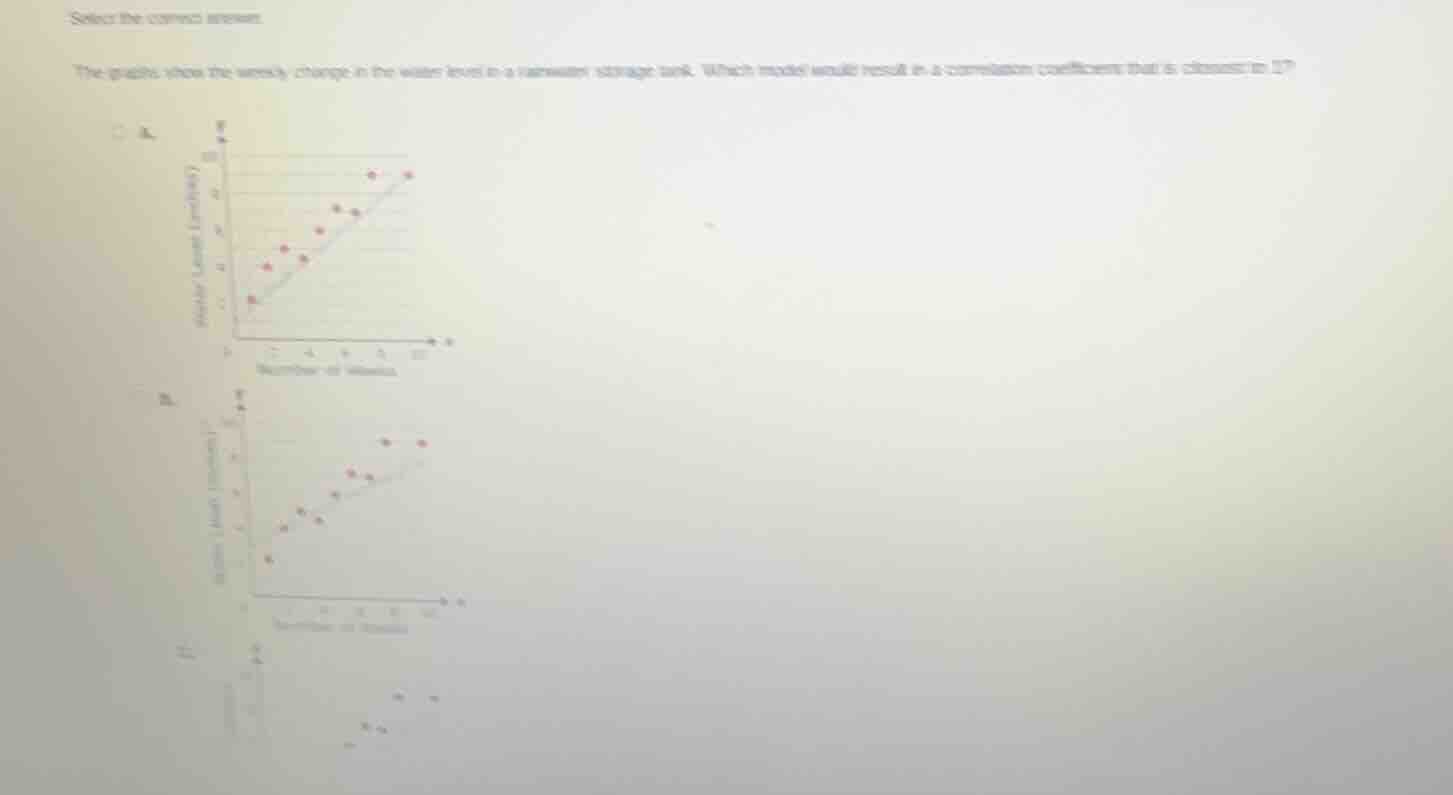
select the correct answer.the graphs show the weekly change in the water level in a rainwater storage tank. which model would result in a correlation coefficient that is closest to 1?
A correlation coefficient close to 1 means there is a strong positive linear relationship between the two variables, where data points lie very close to an upward-sloping straight line. Graph A has points tightly clustered along an upward trend line, showing this strong positive linear association. Graph B has more scattered points, and Graph C shows a weaker, less linear trend.

Snap & solve any problem in the app
Get step-by-step solutions on Sovi AI
Photo-based solutions with guided steps
Explore more problems and detailed explanations
A. [Graph with points tightly following an upward-sloping line]