QUESTION IMAGE
Question
1
select the correct answer.
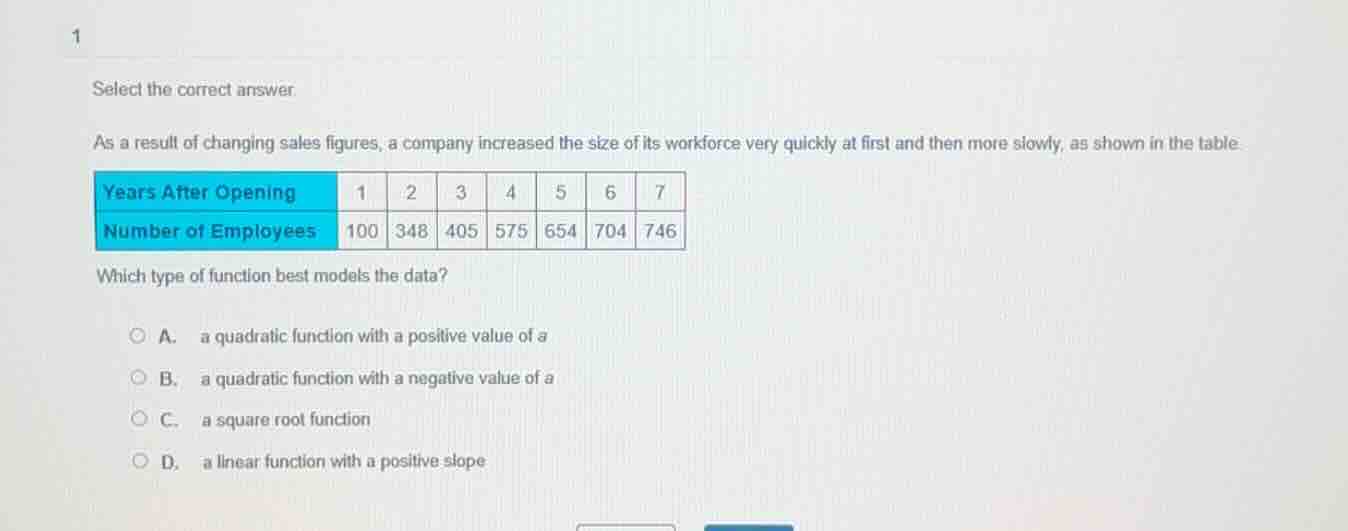
as a result of changing sales figures, a company increased the size of its workforce very quickly at first and then more slowly, as shown in the table
| years after opening | 1 | 2 | 3 | 4 | 5 | 6 | 7 |
|---|
which type of function best models the data?
a. a quadratic function with a positive value of a
b. a quadratic function with a negative value of a
c. a square root function
d. a linear function with a positive slope
Step1: Calculate first differences
Differences: 348-100=248, 405-348=57, 575-405=170, 654-575=79, 704-654=50, 746-704=42
Step2: Calculate second differences
Second differences: 57-248=-191, 170-57=113, 79-170=-91, 50-79=-29, 42-50=-8
Step3: Analyze trend
The first differences decrease over time, indicating a concave down curve. A quadratic function with negative \(a\) (\(ax^2+bx+c, a<0\)) is concave down, matching the data's slowdown in growth. Linear functions have constant differences, square roots grow slower initially (opposite here), and positive \(a\) quadratics are concave up (growth speeds up). Thus, the best model is a quadratic with negative \(a\).

Snap & solve any problem in the app
Get step-by-step solutions on Sovi AI
Photo-based solutions with guided steps
Explore more problems and detailed explanations
B. a quadratic function with a negative value of a