QUESTION IMAGE
Question
select the correct answer.
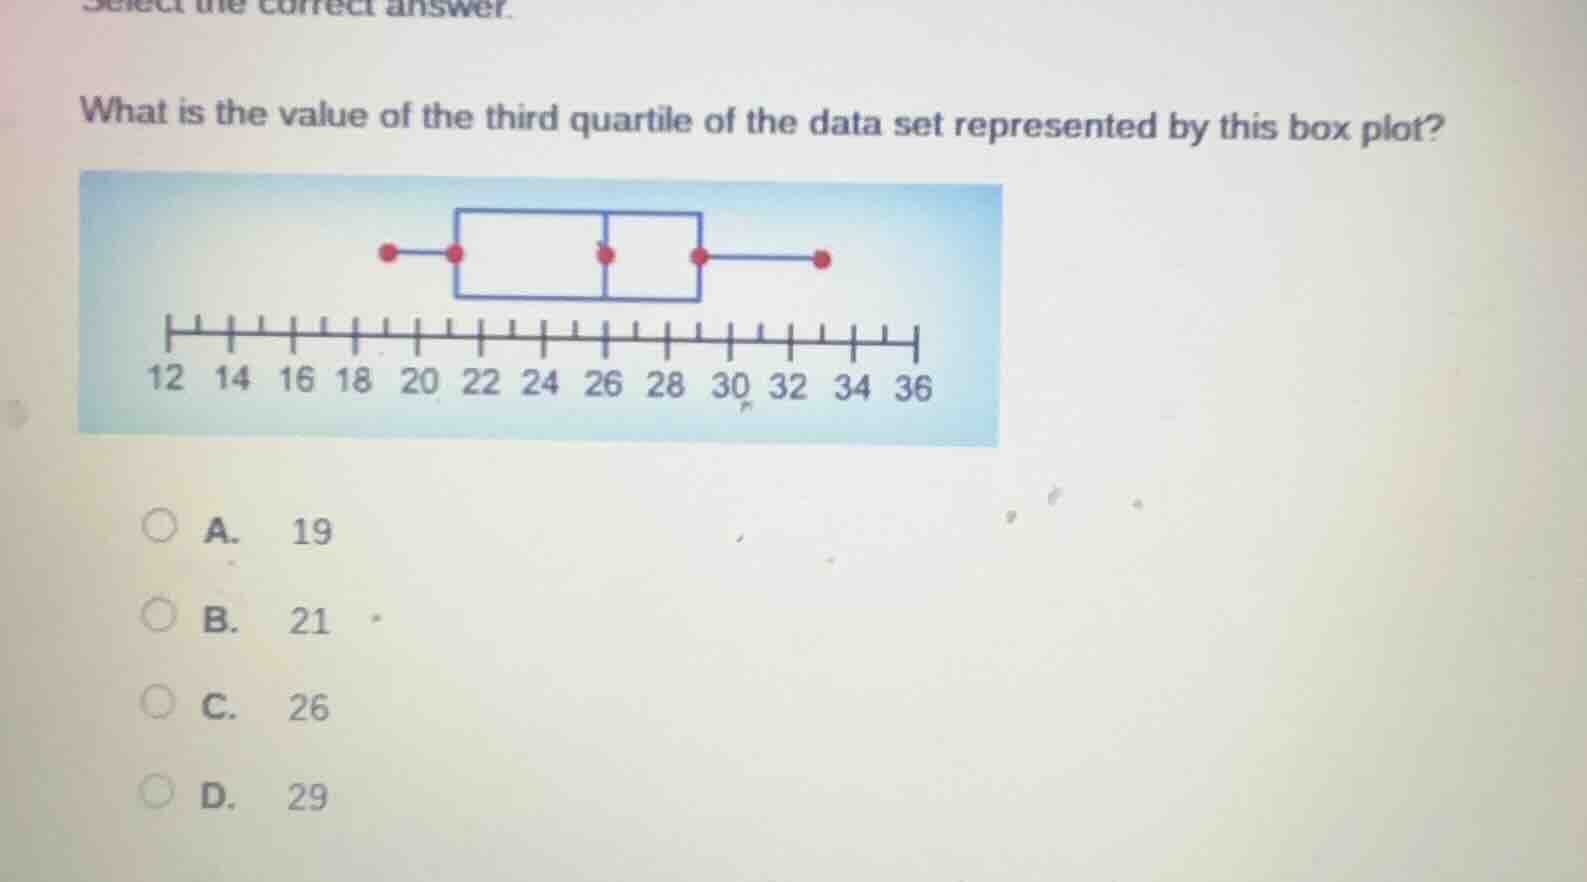
what is the value of the third quartile of the data set represented by this box plot?
box plot image with number line from 12 to 36 and red dots, then options: a. 19, b. 21, c. 26, d. 29
Step1: Recall box plot components
In a box plot, the box has two parts (quartiles). The right end of the box (or the right quartile line) represents the third quartile ($Q_3$), which is the median of the upper half of the data.
Step2: Analyze the box plot
Looking at the box plot, the right end of the box (the third quartile marker) aligns with the value 29 on the number line. The other options (19, 21, 26) do not correspond to the third quartile's position.

Snap & solve any problem in the app
Get step-by-step solutions on Sovi AI
Photo-based solutions with guided steps
Explore more problems and detailed explanations
D. 29