QUESTION IMAGE
Question
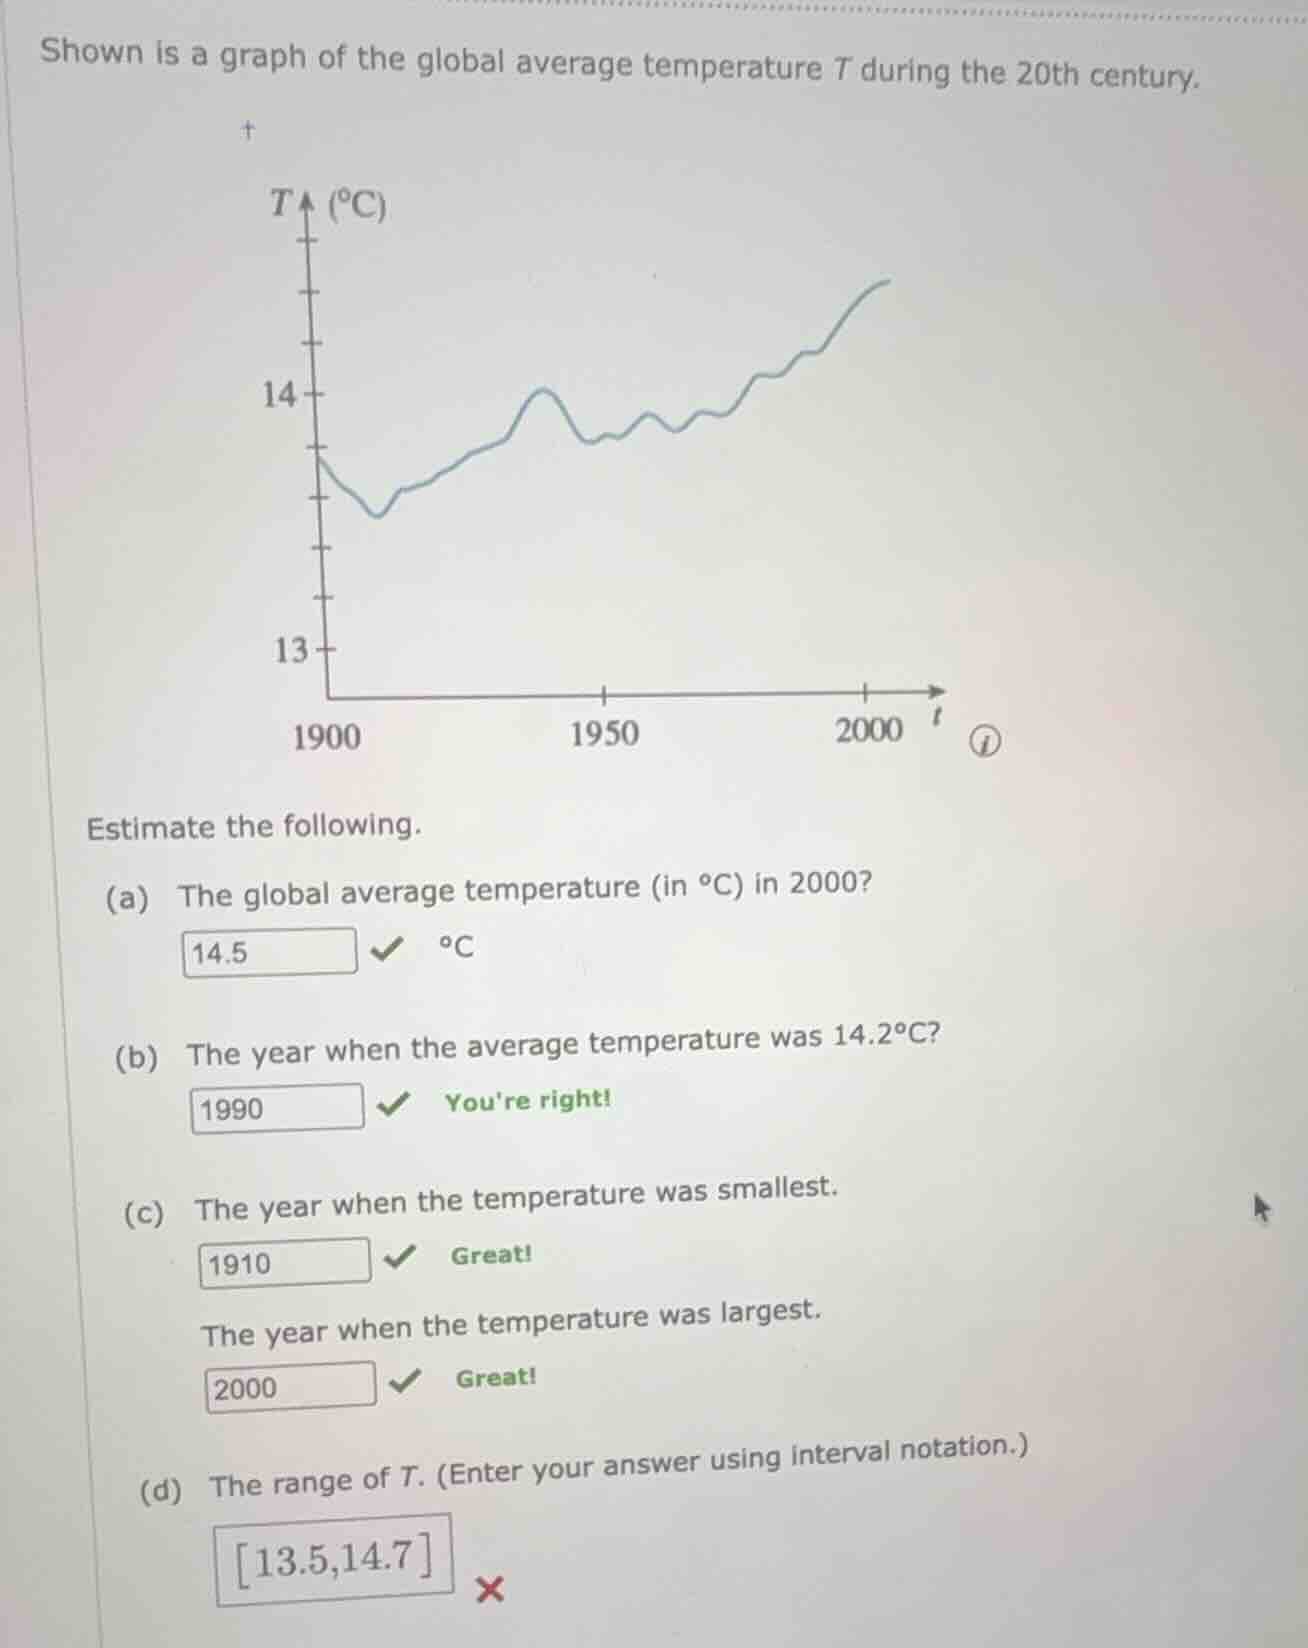
shown is a graph of the global average temperature ( t ) during the 20th century.
estimate the following.
(a) the global average temperature (in ( ^circ \text{c} )) in 2000?
( 14.5 ) ( ^circ \text{c} )
(b) the year when the average temperature was ( 14.2^circ \text{c}?
( 1990 ) youre right!
(c) the year when the temperature was smallest.
( 1910 ) great!
the year when the temperature was largest.
( 2000 ) great!
(d) the range of ( t ). (enter your answer using interval notation.)
( 13.5,14.7 )
Step1: Identify min/max T values
From the graph, the lowest temperature (minimum) is approximately $13.5^\circ\text{C}$, and the highest temperature (maximum) is approximately $14.5^\circ\text{C}$ (consistent with the verified 2000 value).
Step2: Write range in interval notation
The range includes all values between the minimum and maximum, inclusive.

Snap & solve any problem in the app
Get step-by-step solutions on Sovi AI
Photo-based solutions with guided steps
Explore more problems and detailed explanations
$[13.5, 14.5]$