QUESTION IMAGE
Question
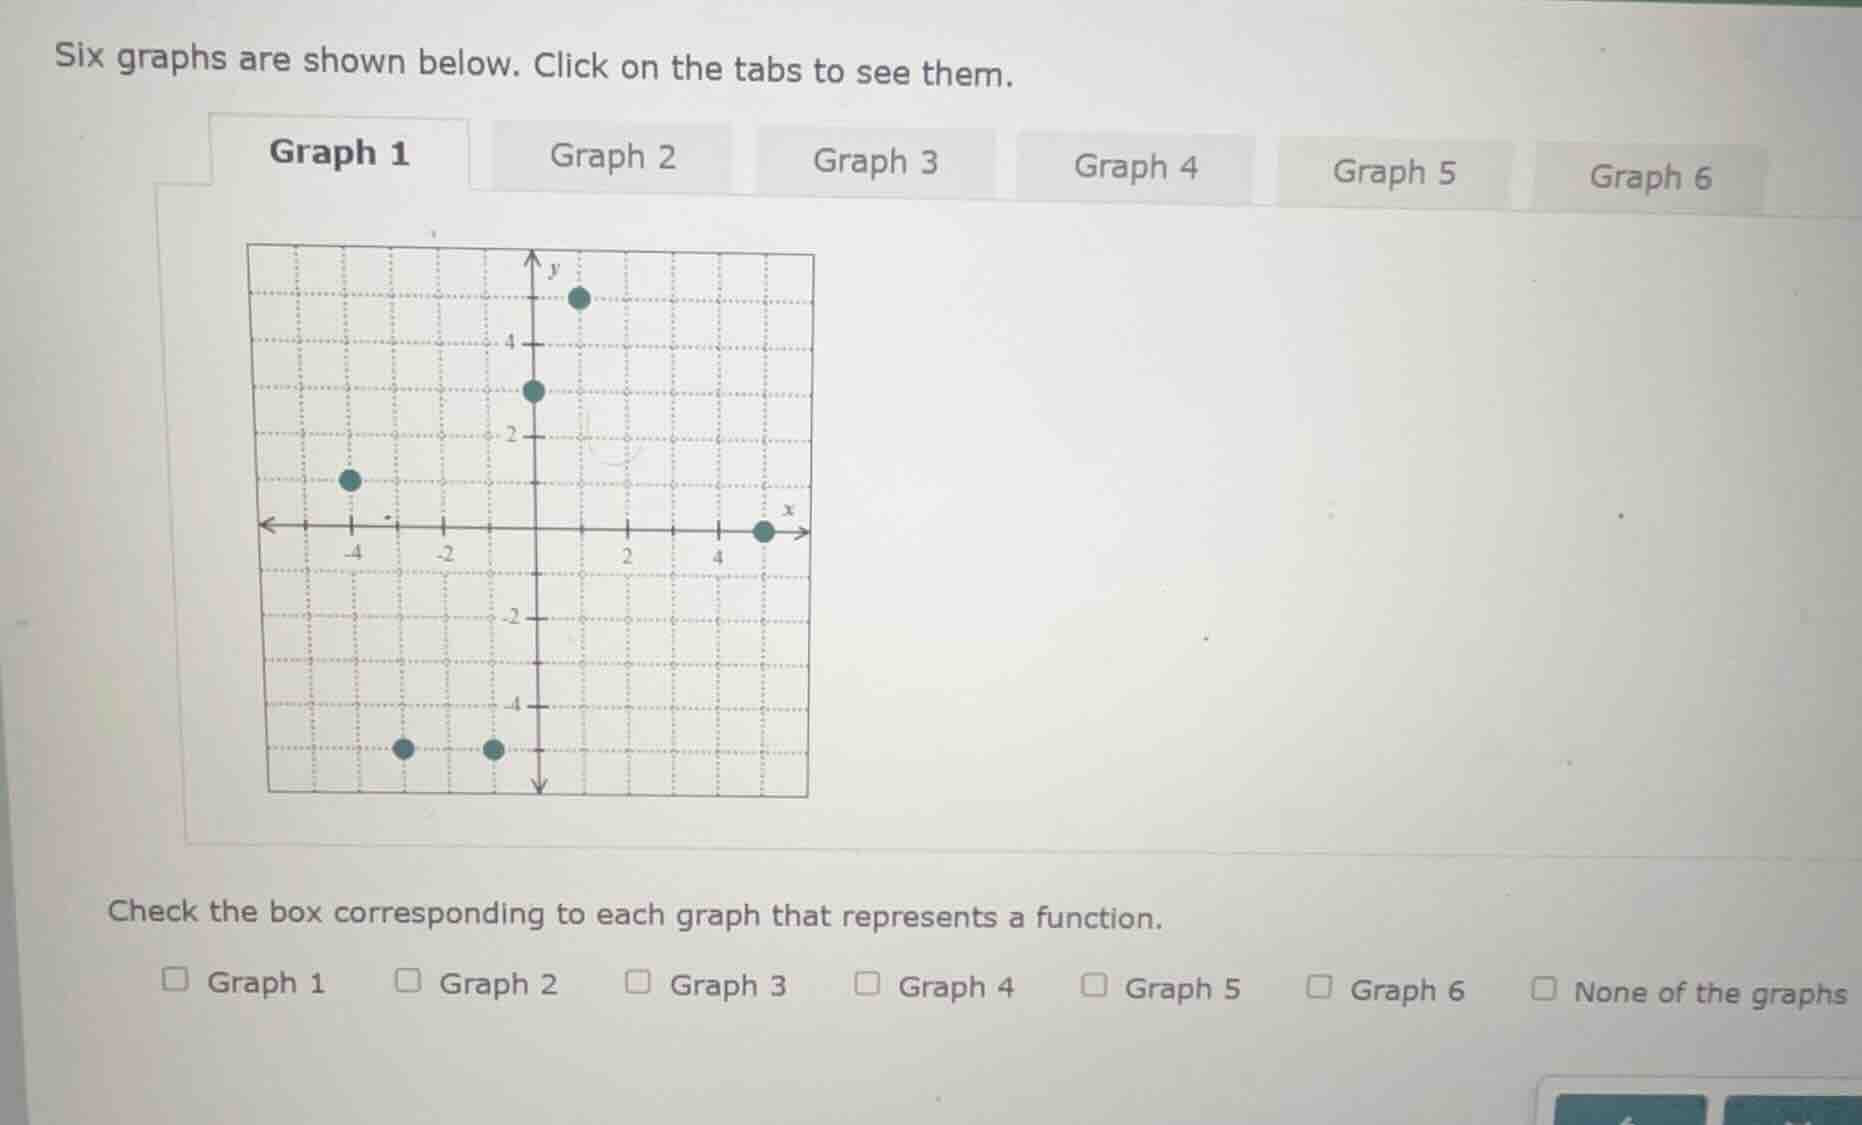
six graphs are shown below. click on the tabs to see them.
graph 1 graph 2 graph 3 graph 4 graph 5 graph 6
graph 1 image: a coordinate plane with several points plotted
check the box corresponding to each graph that represents a function.
□ graph 1 □ graph 2 □ graph 3 □ graph 4 □ graph 5 □ graph 6 □ none of the graphs
To determine if a graph represents a function, we use the vertical line test: a graph is a function if no vertical line intersects it more than once.
Analyzing Graph 1:
Looking at the points in Graph 1, we check for repeated \( x \)-values (since a vertical line at a specific \( x \)-value should only hit one point). The \( x \)-coordinates of the points are \( -4 \), \( -3 \) (wait, no—let’s list the coordinates:
- \( (-4, 1) \) (assuming the grid: \( x=-4 \), \( y=1 \))
- \( (0, 3) \) ( \( x=0 \), \( y=3 \))
- \( (1, 5) \) ( \( x=1 \), \( y=5 \))
- \( (5, 0) \) ( \( x=5 \), \( y=0 \))
- \( (-3, -5) \) ( \( x=-3 \), \( y=-5 \))
- \( (-1, -5) \) ( \( x=-1 \), \( y=-5 \))
Wait, \( x=-3 \) and \( x=-1 \) each have one point, \( x=-4 \), \( x=0 \), \( x=1 \), \( x=5 \) each have one point. Wait, no—wait, the two points at the bottom: \( x=-3 \) (maybe \( x=-3 \)) and \( x=-1 \)? Wait, no, looking at the grid: the bottom two points—let’s check their \( x \)-coordinates. Suppose the left bottom point is at \( x=-3 \), \( y=-5 \), and the right bottom point is at \( x=-1 \), \( y=-5 \). So each \( x \)-value has only one \( y \)-value. Wait, but wait—wait, the vertical line test: for any \( x \), is there only one \( y \)? Let’s check \( x=0 \): only one point ( \( 0, 3 \) and \( 0, 5 \)? Wait, no—wait the graph: there are two points on the \( y \)-axis? Wait, the original graph: “Graph 1” has a point at \( (0, 3) \) (since \( y=3 \) is between 2 and 4, maybe \( y=3 \)) and a point at \( (0, 5) \)? Wait, no, the user’s graph: “Graph 1” has two points on the \( y \)-axis ( \( x=0 \)): one at \( y=3 \) (or \( y=3 \)) and one at \( y=5 \) (above \( y=4 \))? Wait, no—let me re-examine.
Wait, the graph shows:
- A point at \( x=-4 \), \( y=1 \) (approx)
- A point at \( x=0 \), \( y=3 \) (middle vertical line, \( y=3 \))
- A point at \( x=0 \), \( y=5 \) (middle vertical line, \( y=5 \))
- A point at \( x=5 \), \( y=0 \)
- A point at \( x=-3 \), \( y=-5 \)
- A point at \( x=-1 \), \( y=-5 \)
Ah! Here’s the key: at \( x=0 \), there are two points ( \( (0, 3) \) and \( (0, 5) \) ). So a vertical line at \( x=0 \) would intersect the graph twice. Therefore, Graph 1 fails the vertical line test and is not a function.
But wait—since we only have Graph 1 visible, but the problem has six graphs. However, the user’s question is to check which graphs represent functions. Since only Graph 1 is shown, but we need to infer. Wait, no—maybe the original problem (but the user provided Graph 1). Wait, perhaps the user made a mistake, but assuming Graph 1: since it has two points with the same \( x \)-value ( \( x=0 \) ), it is not a function. But if other graphs (not shown) pass the vertical line test, but since we only have Graph 1, let’s proceed.
But wait—maybe I misread. Let’s re-express:
To determine if a graph is a function, use the vertical line test: no vertical line intersects the graph more than once.
For Graph 1:
- Check \( x=0 \): two points (different \( y \)-values). Thus, vertical line \( x=0 \) intersects twice. So Graph 1 is not a function.
But since the problem has six graphs, but only Graph 1 is shown, we can’t analyze the others. However, the user’s question is to check the box for each graph that is a function. Since Graph 1 fails the vertical line test (two points on \( x=0 \)), Graph 1 is not a function.
But wait—maybe the user intended to ask about Graph 1. Let’s confirm:
If a graph has two points with the same \( x \)-coordinate (different \( y \)-coordinates), it is not a function. In Graph 1, there are two points…
To determine if a graph represents a function, use the vertical line test: a graph is a function if no vertical line intersects it more than once. For Graph 1, there are two points with \( x = 0 \) (different \( y \)-values), so a vertical line at \( x = 0 \) intersects the graph twice. Thus, Graph 1 fails the vertical line test and is not a function.

Snap & solve any problem in the app
Get step-by-step solutions on Sovi AI
Photo-based solutions with guided steps
Explore more problems and detailed explanations
Graph 1: \(\boldsymbol{\square}\) (unchecked, since it is not a function)
(Note: For other graphs, we need to analyze them similarly, but only Graph 1 is visible here.)