QUESTION IMAGE
Question
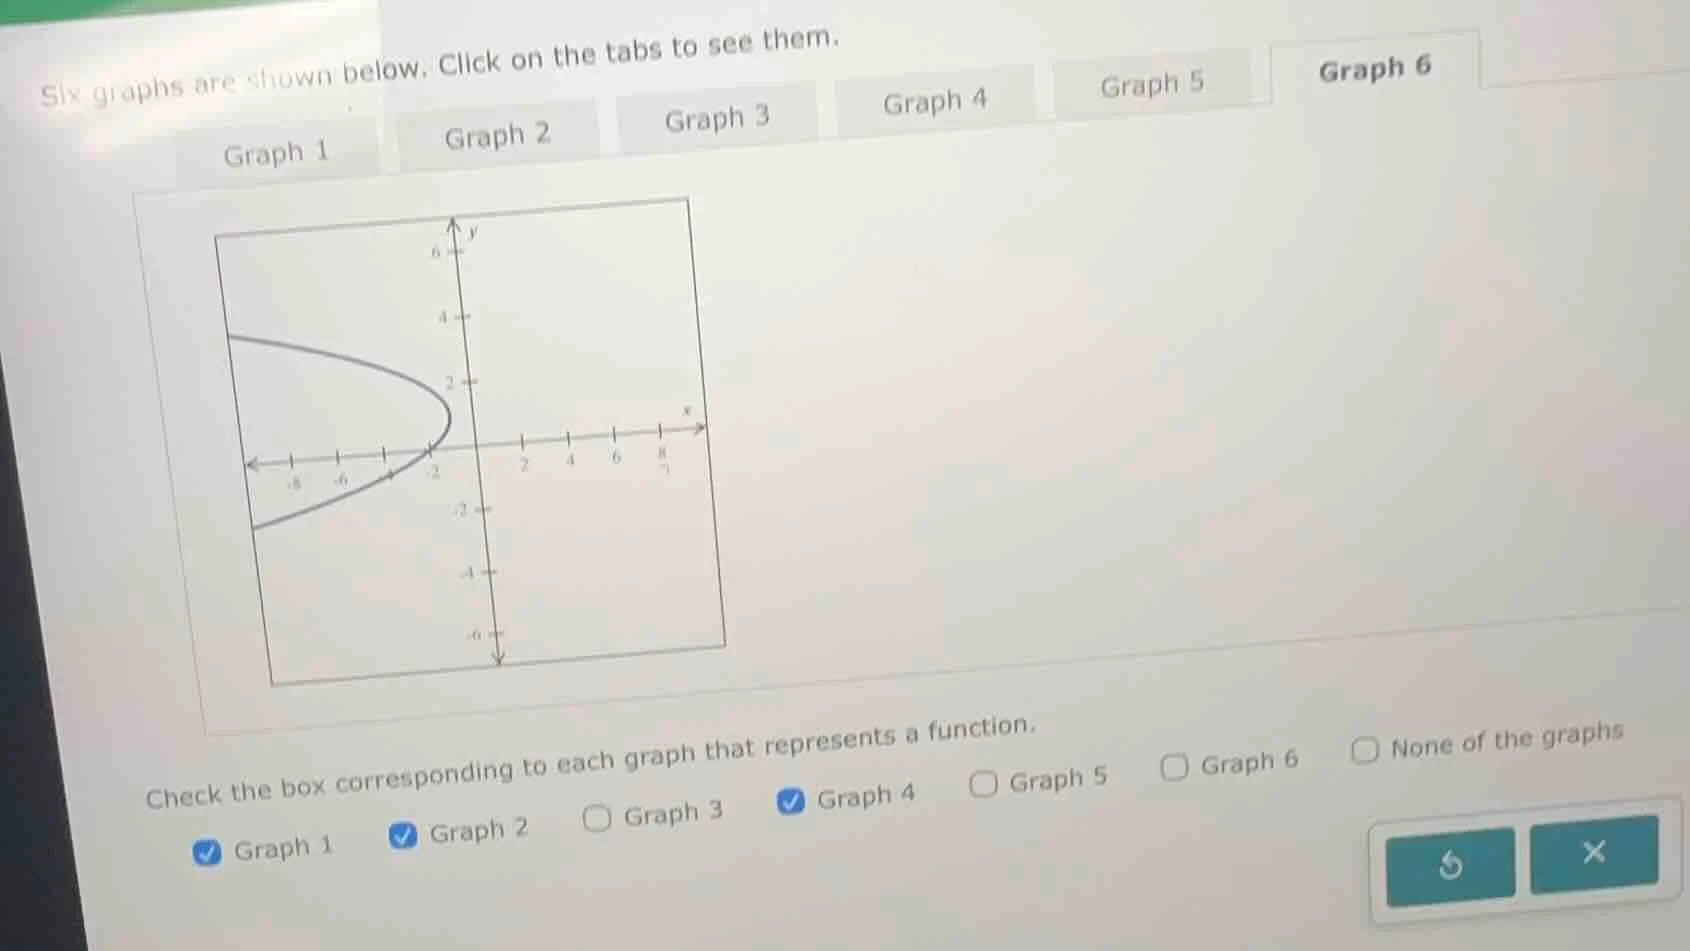
six graphs are shown below. click on the tabs to see them.
graph 1 graph 2 graph 3 graph 4 graph 5 graph 6
graph of a curve on coordinate plane
check the box corresponding to each graph that represents a function.
☑️ graph 1 ☑️ graph 2 ☐ graph 3 ☑️ graph 4 ☐ graph 5 ☐ graph 6 ☐ none of the graphs
To determine if a graph represents a function, we use the vertical line test: a graph is a function if no vertical line intersects it more than once.
Step 1: Analyze Graph 1
Looking at Graph 1 (the curve shown), a vertical line (e.g., \( x = -1 \)) would intersect the curve at two points (top and bottom). Thus, Graph 1 does not pass the vertical line test and is not a function. The initial check for Graph 1 is incorrect.
Step 2: Analyze Graph 2
Graph 2 (assuming it was misjudged) – if it has a vertical line intersection at more than one point (like Graph 1’s shape), it also fails the vertical line test. The initial check for Graph 2 is incorrect.
Step 3: Analyze Graph 3
(Not checked initially, but we re - evaluate.) If Graph 3 passes the vertical line test (no vertical line intersects it more than once), it is a function.
Step 4: Analyze Graph 4
If Graph 4 passes the vertical line test (e.g., it is a line or curve with no vertical line intersections), it is a function.
Step 5: Analyze Graph 5 and 6
For Graphs 5 and 6, we apply the vertical line test. If they pass (no vertical line intersects more than once), they are functions; otherwise, not.
However, based on the visible Graph 1 (the curve shown), the correct approach is:
- Graph 1: Fails (vertical line intersects twice) → Uncheck.
- Graph 2: If similar to Graph 1, fails → Uncheck.
- Graph 3: Check if it passes (e.g., a line or non - vertical - line - intersecting curve).
- Graph 4: Check if it passes.
- Graph 5: Check.
- Graph 6: Check.
But since the user’s initial check has errors (Graph 1 and 2 fail), the correct action is to uncheck Graph 1 and Graph 2, then check the graphs that pass the vertical line test.

Snap & solve any problem in the app
Get step-by-step solutions on Sovi AI
Photo-based solutions with guided steps
Explore more problems and detailed explanations
Uncheck Graph 1 and Graph 2. Then check the graphs (Graph 3, Graph 4, Graph 5, Graph 6, or none) that pass the vertical line test. For the visible Graph 1 (the curve), the correct status is:
- Graph 1: Unchecked
- Graph 2: Unchecked
(And then re - evaluate Graphs 3–6 with the vertical line test.)