QUESTION IMAGE
Question
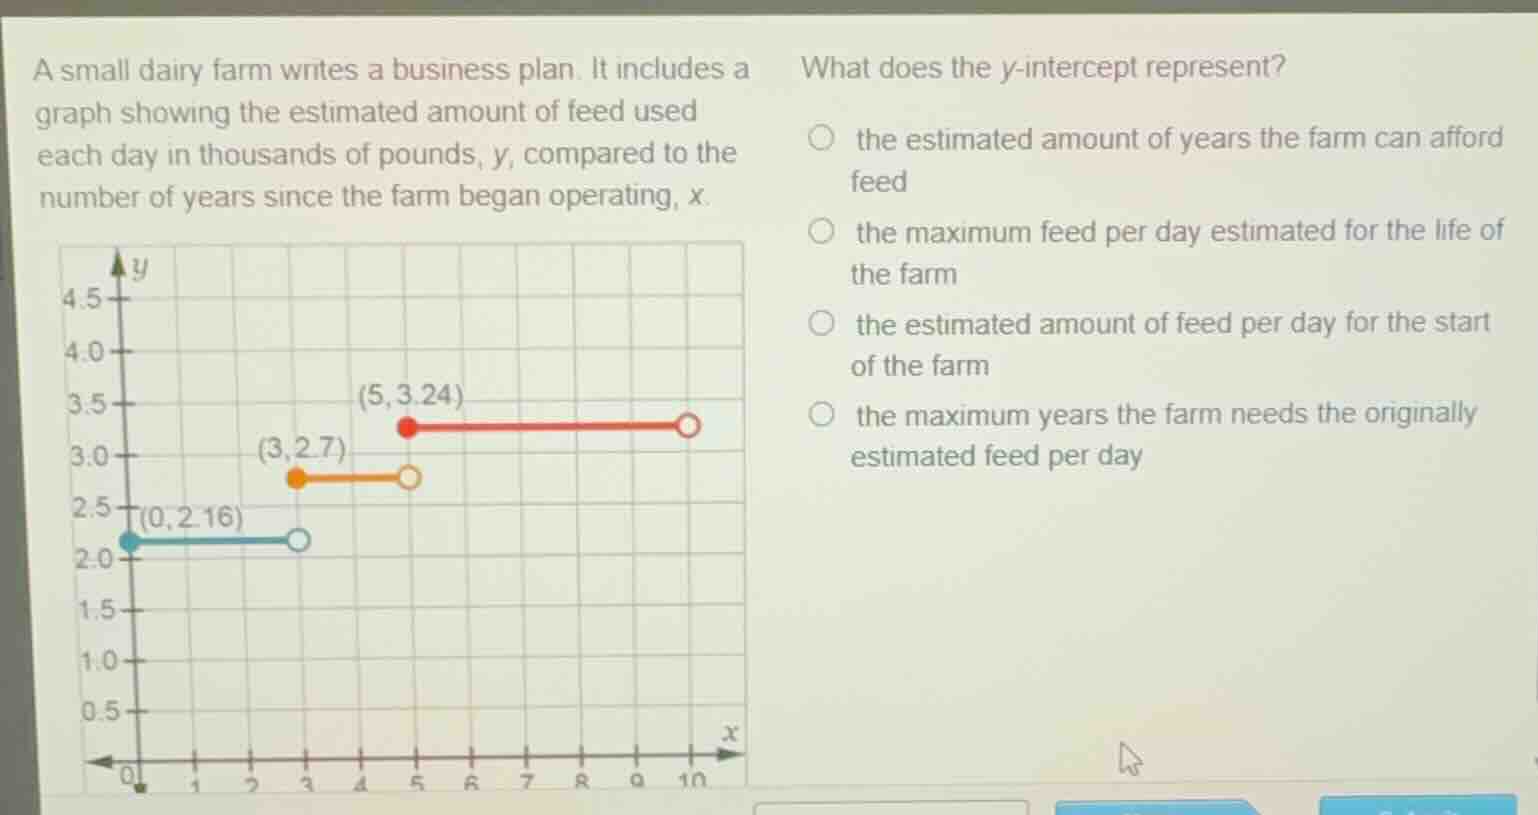
a small dairy farm writes a business plan. it includes a graph showing the estimated amount of feed used each day in thousands of pounds, y, compared to the number of years since the farm began operating, x.
what does the y-intercept represent?
the estimated amount of years the farm can afford feed
the maximum feed per day estimated for the life of the farm
the estimated amount of feed per day for the start of the farm
the maximum years the farm needs the originally estimated feed per day
The y - intercept of a graph is the point where \(x = 0\). In this context, \(x\) represents the number of years since the farm began operating, so when \(x = 0\), it is the start of the farm's operation. The \(y\) - value at \(x = 0\) (the y - intercept \((0,2.16)\)) represents the estimated amount of feed per day (in thousands of pounds) at the start of the farm. The first option is incorrect as the y - intercept is about feed amount, not years the farm can afford feed. The second option is incorrect as the y - intercept is not the maximum feed per day. The fourth option is incorrect as the y - intercept is not about the maximum years for the originally estimated feed per day.

Snap & solve any problem in the app
Get step-by-step solutions on Sovi AI
Photo-based solutions with guided steps
Explore more problems and detailed explanations
the estimated amount of feed per day for the start of the farm