QUESTION IMAGE
Question
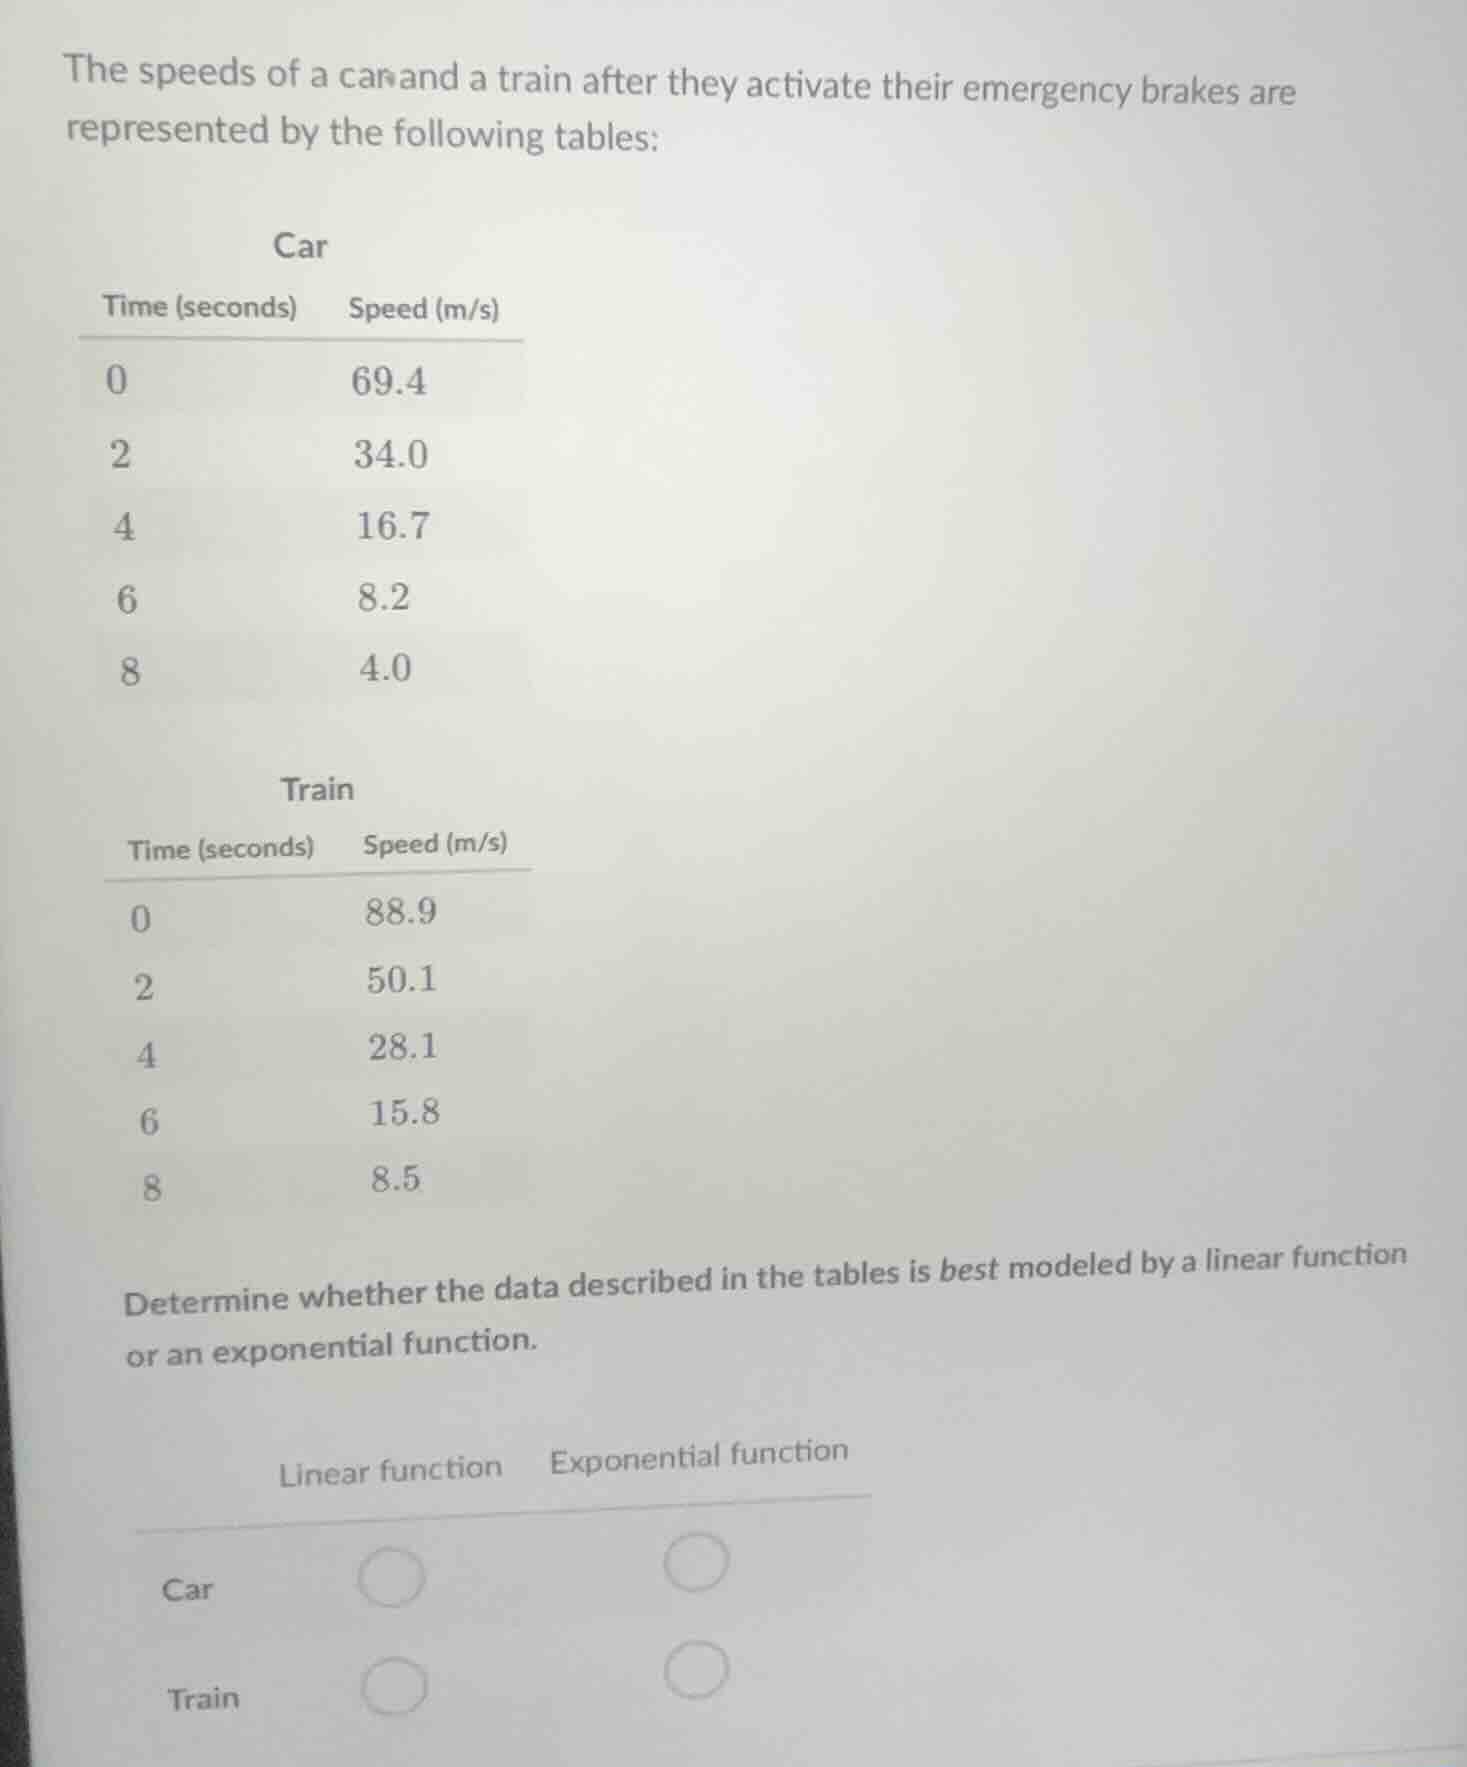
the speeds of a car and a train after they activate their emergency brakes are represented by the following tables: car time (seconds) speed (m/s) 0 69.4 2 34.0 4 16.7 6 8.2 8 4.0 train time (seconds) speed (m/s) 0 88.9 2 50.1 4 28.1 6 15.8 8 8.5 determine whether the data described in the tables is best modeled by a linear function or an exponential function. linear function exponential function car train
Step1: Check car speed differences
Calculate speed changes between consecutive times:
$69.4 - 34.0 = 35.4$
$34.0 - 16.7 = 17.3$
$16.7 - 8.2 = 8.5$
$8.2 - 4.0 = 4.2$
Check speed ratios:
$\frac{34.0}{69.4} \approx 0.49$, $\frac{16.7}{34.0} \approx 0.49$, $\frac{8.2}{16.7} \approx 0.49$, $\frac{4.0}{8.2} \approx 0.49$
Step2: Check train speed differences
Calculate speed changes between consecutive times:
$88.9 - 50.1 = 38.8$
$50.1 - 28.1 = 22.0$
$28.1 - 15.8 = 12.3$
$15.8 - 8.5 = 7.3$
Check speed ratios:
$\frac{50.1}{88.9} \approx 0.56$, $\frac{28.1}{50.1} \approx 0.56$, $\frac{15.8}{28.1} \approx 0.56$, $\frac{8.5}{15.8} \approx 0.54$ (close to 0.56, rounding error)
Step3: Classify model type
Linear models have constant differences; exponential models have constant ratios.
Car has consistent speed ratios. Train has consistent speed ratios.

Snap & solve any problem in the app
Get step-by-step solutions on Sovi AI
Photo-based solutions with guided steps
Explore more problems and detailed explanations
Car: Exponential function
Train: Exponential function