QUESTION IMAGE
Question
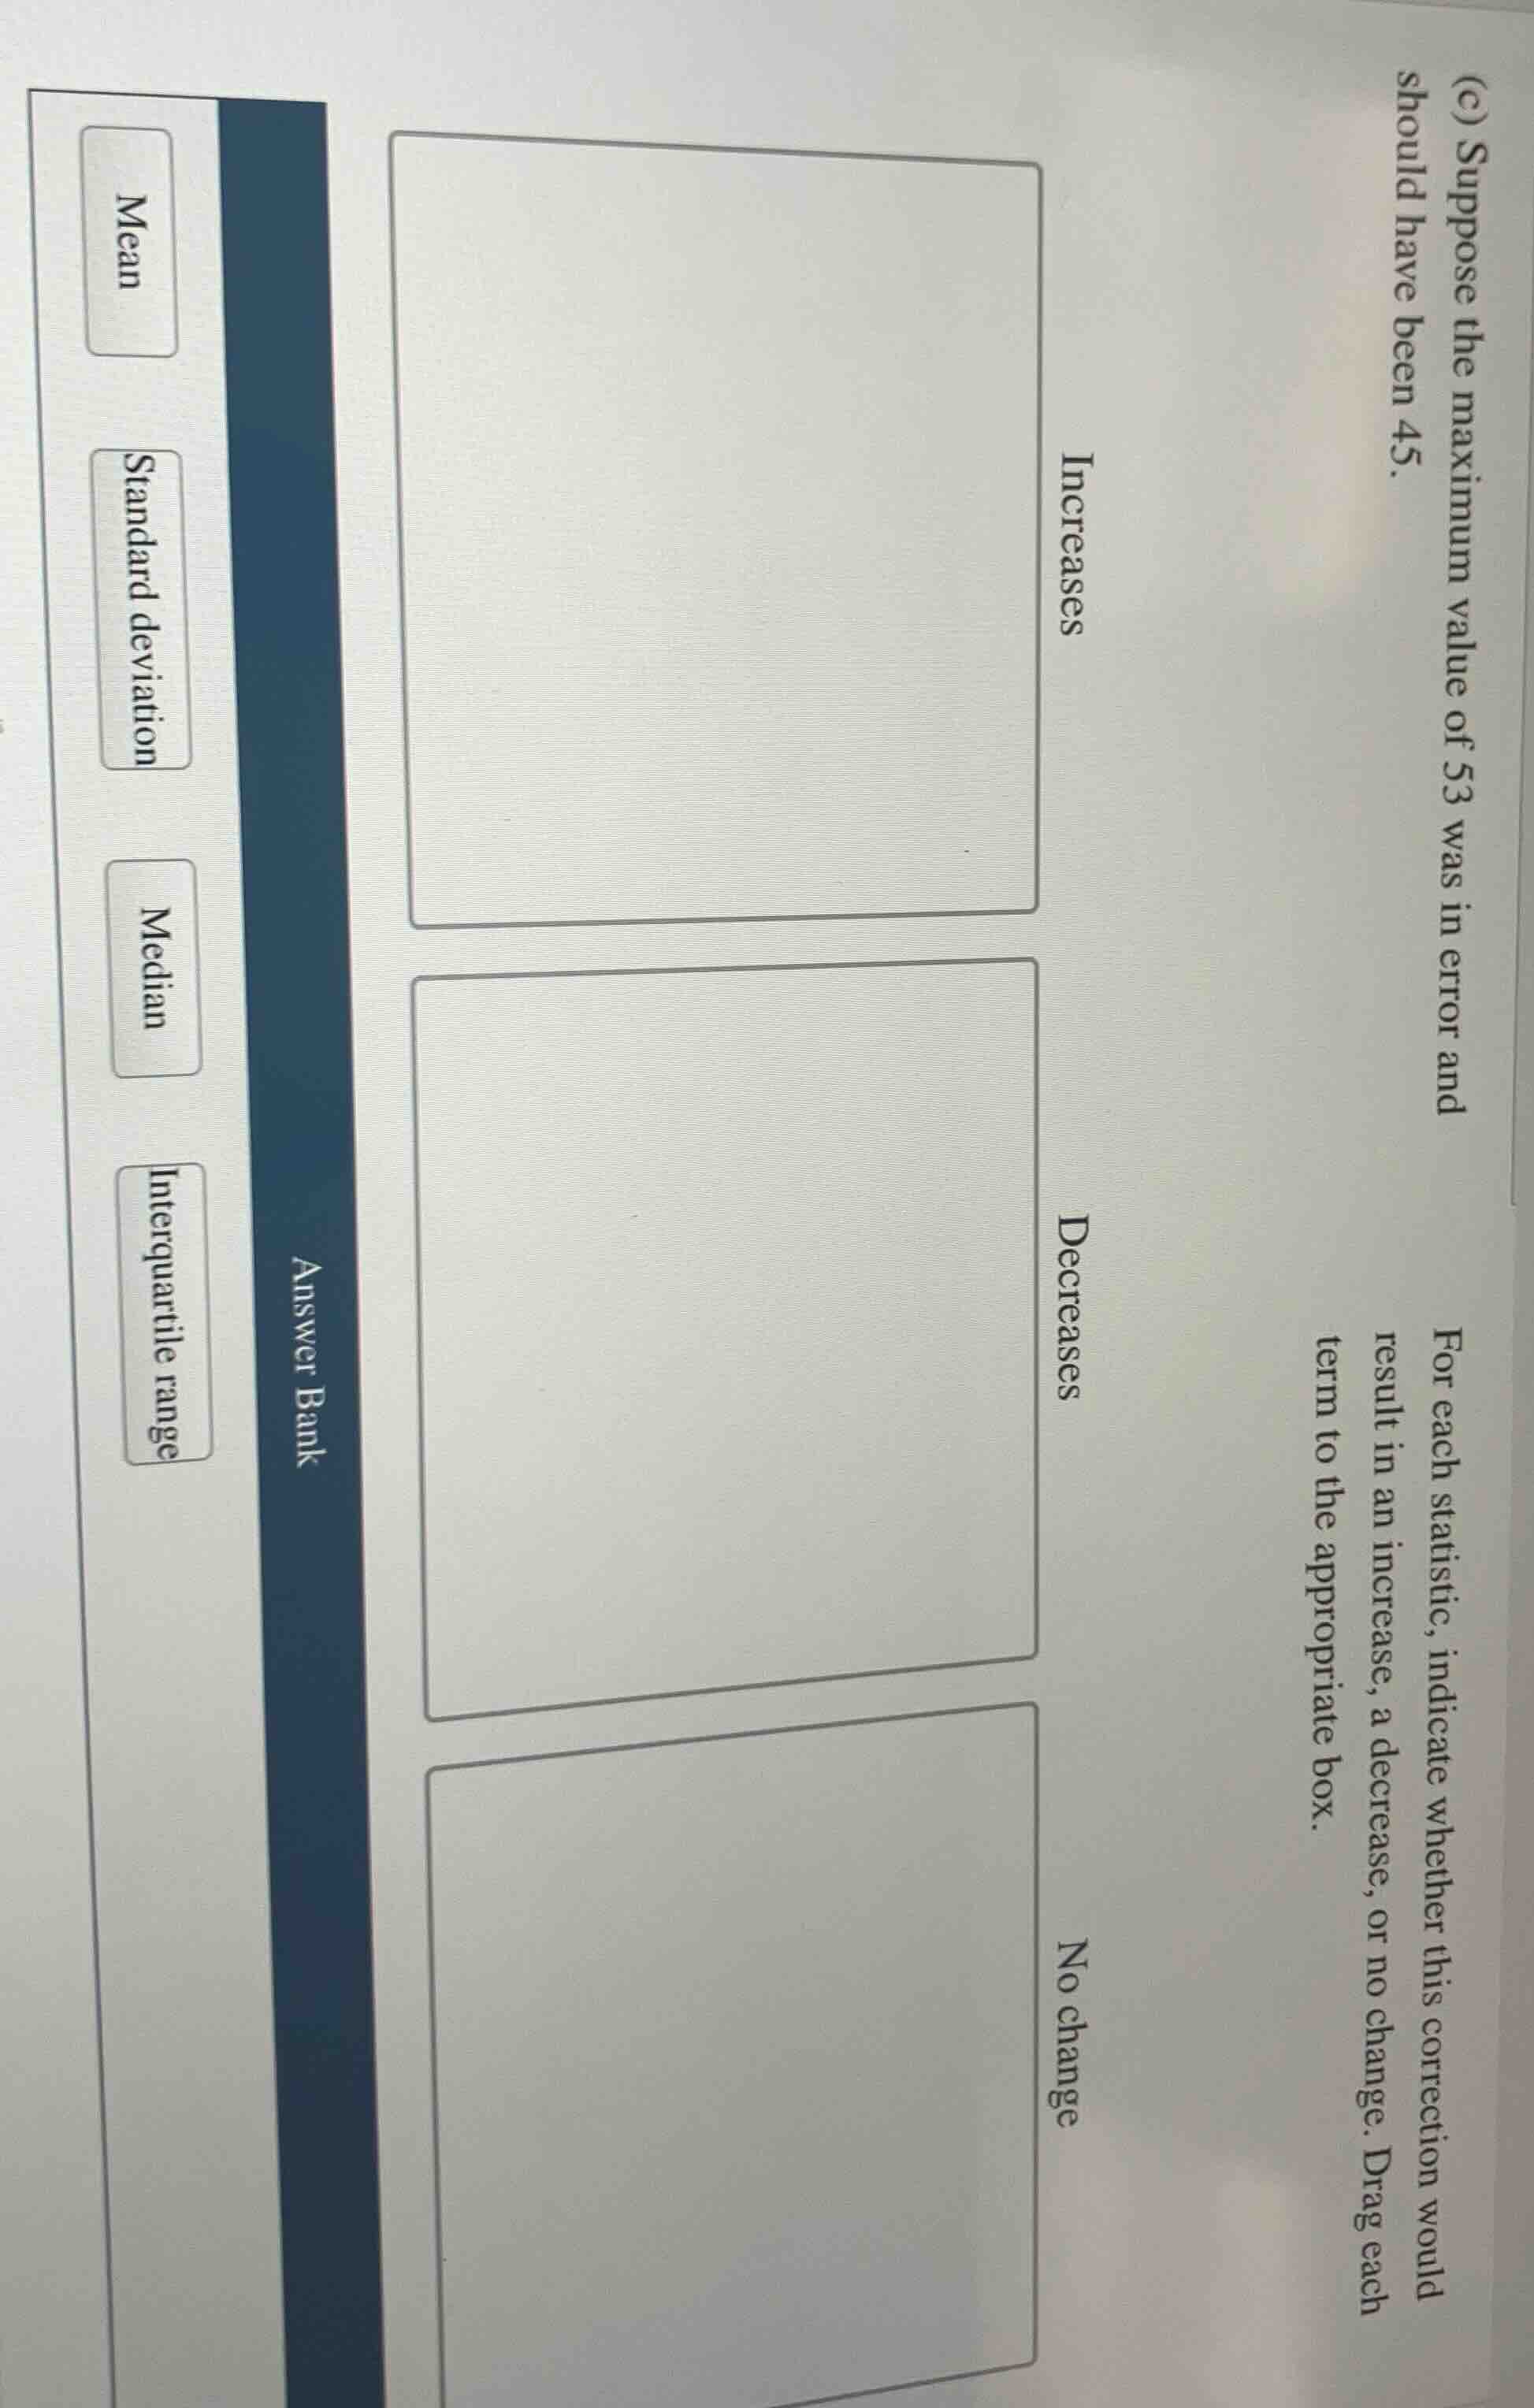
(c) suppose the maximum value of 53 was in error and should have been 45. for each statistic, indicate whether this correction would result in an increase, a decrease, or no change. drag each term to the appropriate box. answer bank mean standard deviation median interquartile range increases decreases no change
To solve this, we analyze each statistic when the maximum value (53) is corrected to 45:
1. Mean
The mean is the sum of values divided by the number of values. Since we’re reducing the maximum value (from 53 to 45, a decrease of 8), the total sum decreases. With the number of values unchanged, the mean will decrease.
2. Standard Deviation
Standard deviation measures the spread of data. A smaller maximum value (closer to the mean) reduces the overall spread. Thus, the standard deviation decreases.
3. Median
The median is the middle value (or average of two middle values) when data is ordered. Changing the maximum value (which is at the end of the ordered data) does not affect the middle value(s). So, the median remains unchanged.
4. Interquartile Range (IQR)
IQR is the difference between the third quartile (\(Q_3\)) and the first quartile (\(Q_1\)), which depend on the middle 50% of data. The maximum value (an extreme value) does not impact \(Q_1\) or \(Q_3\). Thus, IQR remains unchanged.
Final Matching:
- Mean: Decreases
- Standard deviation: Decreases
- Median: No change
- Interquartile range: No change
(To present as drag-and-drop: Drag "Mean" to "Decreases", "Standard deviation" to "Decreases", "Median" to "No change", "Interquartile range" to "No change".)

Snap & solve any problem in the app
Get step-by-step solutions on Sovi AI
Photo-based solutions with guided steps
Explore more problems and detailed explanations
To solve this, we analyze each statistic when the maximum value (53) is corrected to 45:
1. Mean
The mean is the sum of values divided by the number of values. Since we’re reducing the maximum value (from 53 to 45, a decrease of 8), the total sum decreases. With the number of values unchanged, the mean will decrease.
2. Standard Deviation
Standard deviation measures the spread of data. A smaller maximum value (closer to the mean) reduces the overall spread. Thus, the standard deviation decreases.
3. Median
The median is the middle value (or average of two middle values) when data is ordered. Changing the maximum value (which is at the end of the ordered data) does not affect the middle value(s). So, the median remains unchanged.
4. Interquartile Range (IQR)
IQR is the difference between the third quartile (\(Q_3\)) and the first quartile (\(Q_1\)), which depend on the middle 50% of data. The maximum value (an extreme value) does not impact \(Q_1\) or \(Q_3\). Thus, IQR remains unchanged.
Final Matching:
- Mean: Decreases
- Standard deviation: Decreases
- Median: No change
- Interquartile range: No change
(To present as drag-and-drop: Drag "Mean" to "Decreases", "Standard deviation" to "Decreases", "Median" to "No change", "Interquartile range" to "No change".)