QUESTION IMAGE
Question
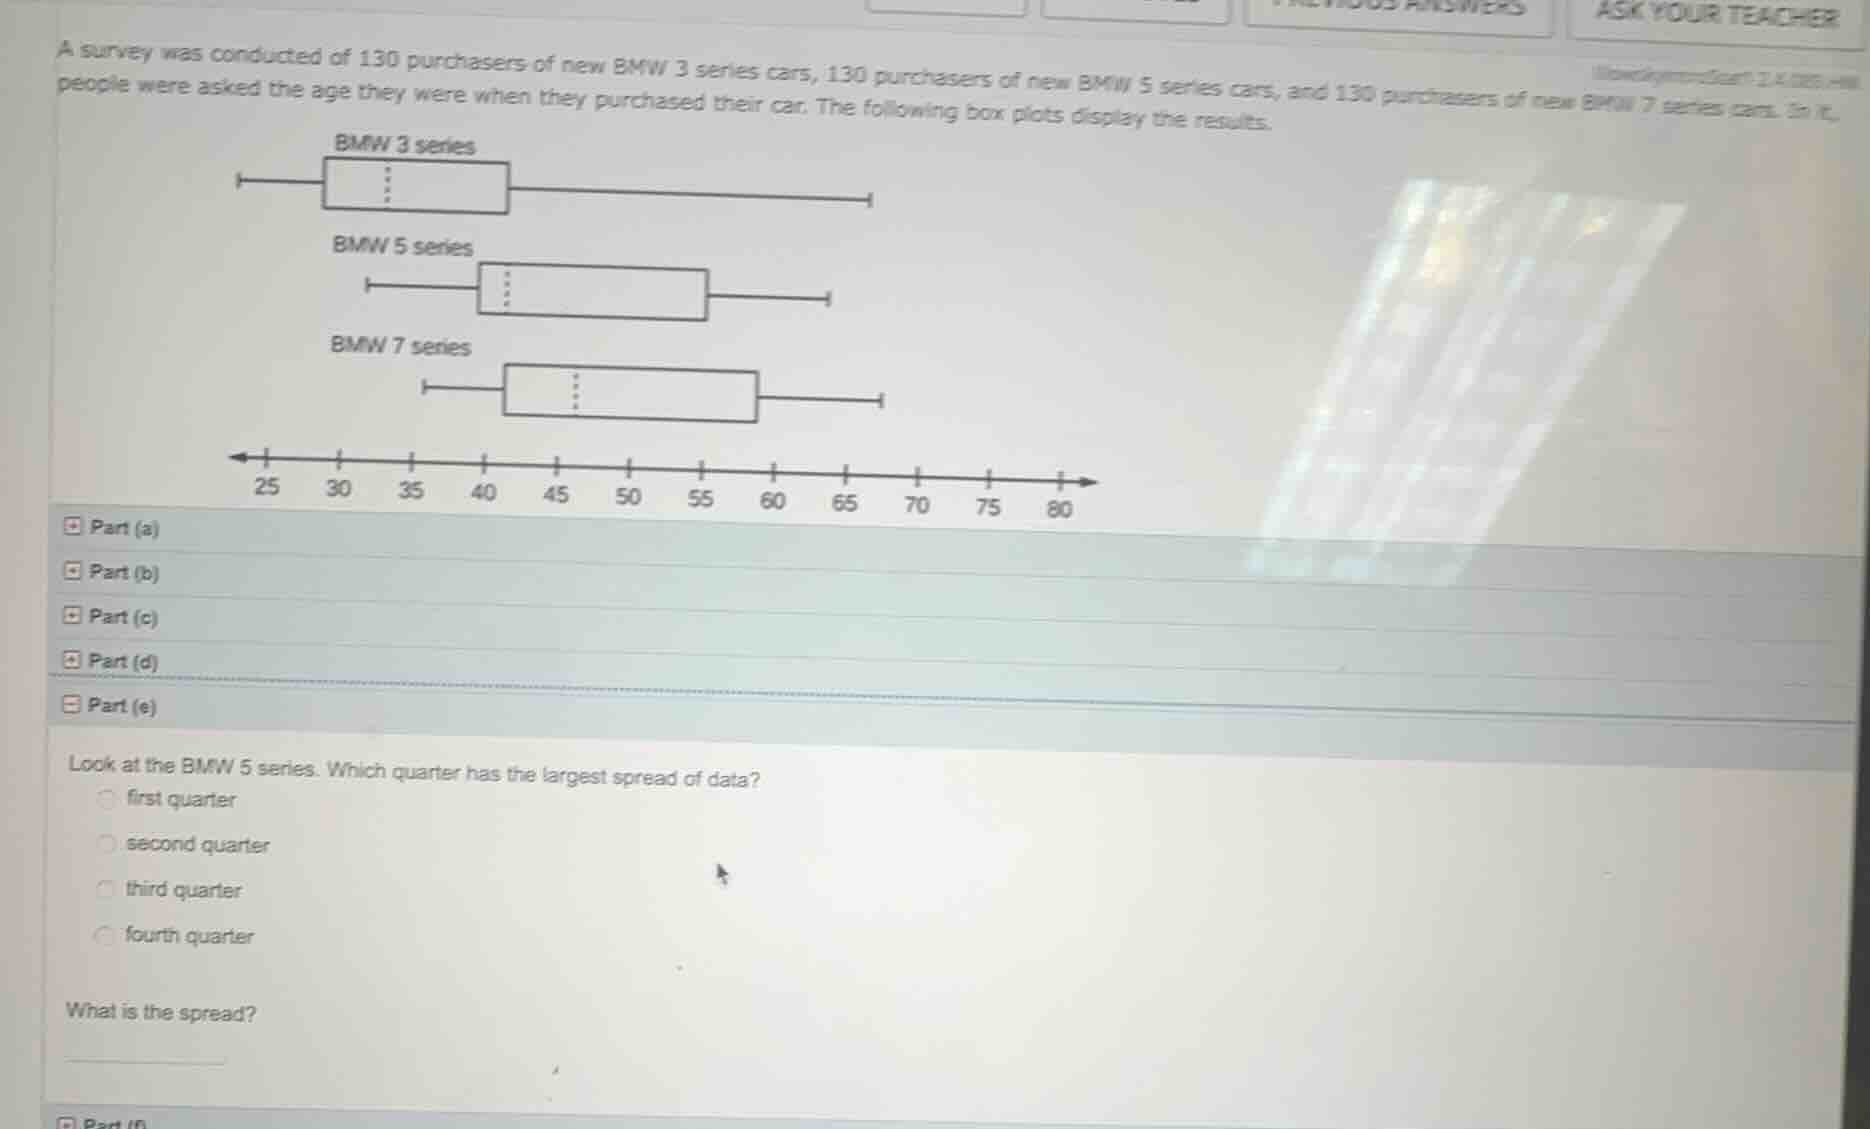
a survey was conducted of 130 purchasers of new bmw 3 series cars, 130 purchasers of new bmw 5 series cars, and 130 purchasers of new bmw 7 series cars. in it, people were asked the age they were when they purchased their car. the following box plots display the results. look at the bmw 5 series. which quarter has the largest spread of data? first quarter second quarter third quarter fourth quarter what is the spread?
Part (e) - First Question (Which quarter has the largest spread)
In a box - plot, the box is divided into four parts (quarters) by the median and the quartiles ($Q_1$, $Q_2$ (median), $Q_3$). The first quarter is from the minimum to $Q_1$, the second from $Q_1$ to $Q_2$, the third from $Q_2$ to $Q_3$, and the fourth from $Q_3$ to the maximum. The length of each segment (between the relevant values) represents the spread of that quarter. Looking at the BMW 5 - series box - plot, we compare the lengths of the four segments. The third quarter (from the median to $Q_3$) has the largest length among the four quarters.
Step 1: Identify the values for the third quarter
For the third quarter of the BMW 5 - series, we need to find the difference between $Q_3$ and the median ($Q_2$). From the box - plot, assume that the median (inside the box, the dotted line) is at 45 and $Q_3$ is at 55 (we estimate from the axis which has marks at 25, 30, 35, 40, 45, 50, 55, 60, 65, 70, 75, 80).
Step 2: Calculate the spread
The spread of the third quarter is $Q_3 - Q_2$. So, if $Q_2 = 45$ and $Q_3=55$, then the spread is $55 - 45=10$. (Note: The actual values may vary slightly depending on the exact plot, but the method is to find the difference between the upper bound of the third quarter and the median)

Snap & solve any problem in the app
Get step-by-step solutions on Sovi AI
Photo-based solutions with guided steps
Explore more problems and detailed explanations
third quarter