QUESTION IMAGE
Question
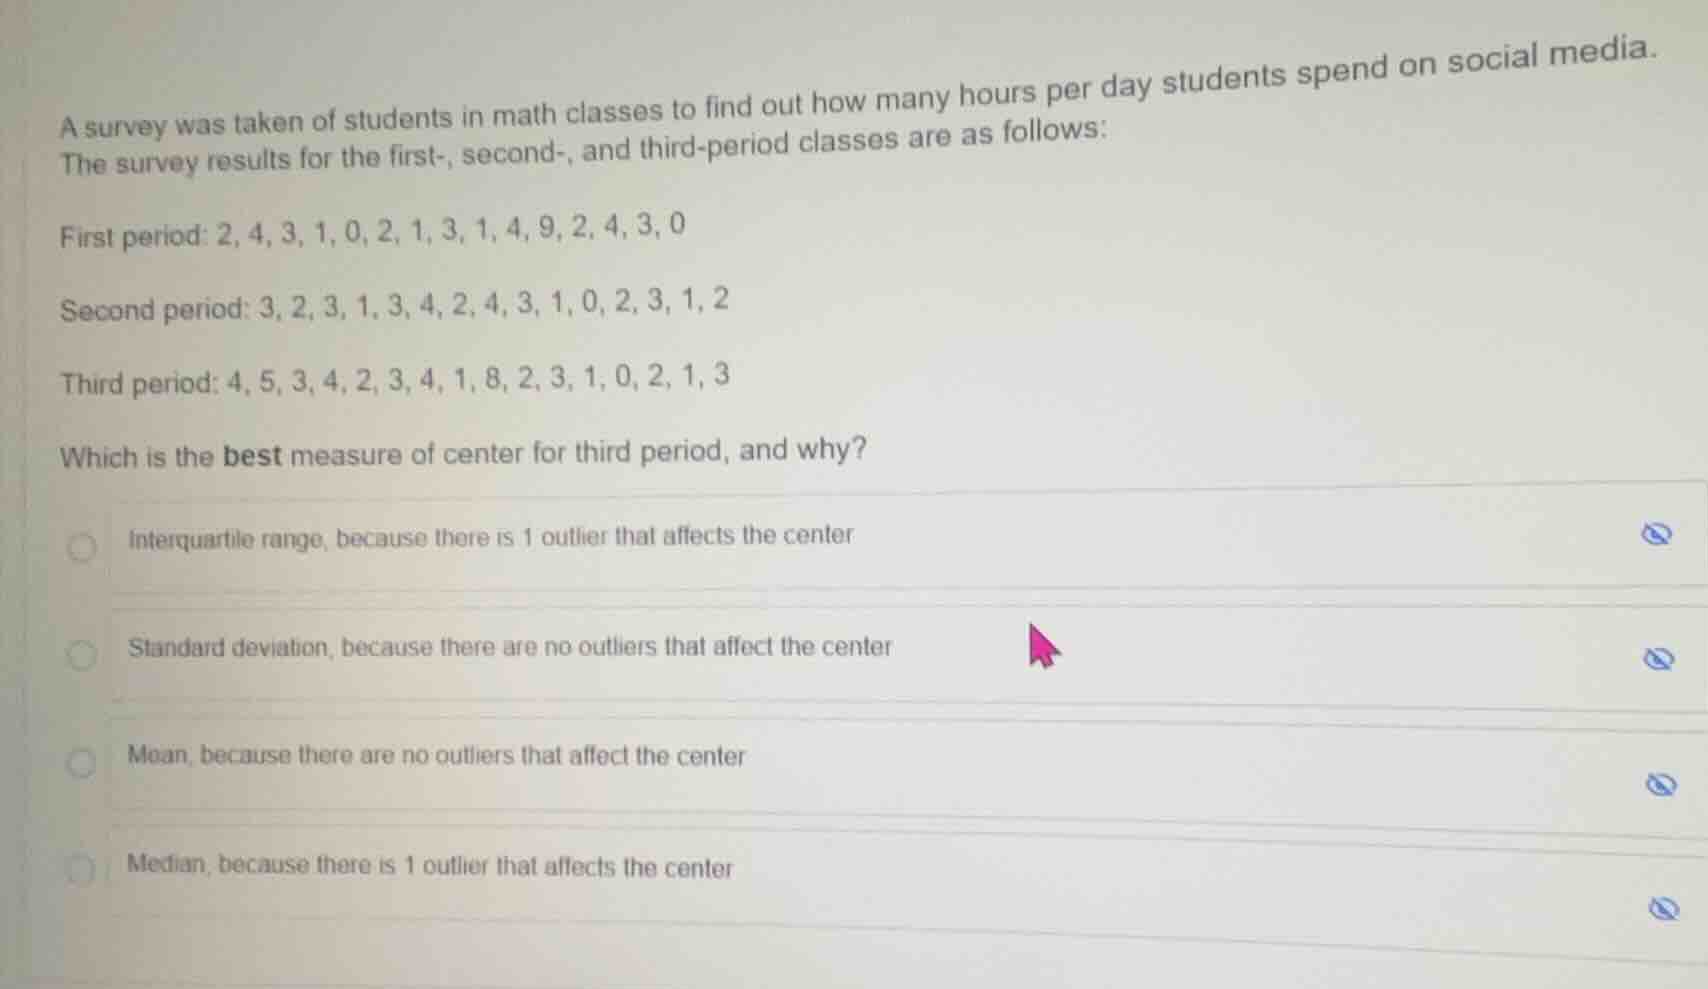
a survey was taken of students in math classes to find out how many hours per day students spend on social media.
the survey results for the first-, second-, and third-period classes are as follows:
first period: 2, 4, 3, 1, 0, 2, 1, 3, 1, 4, 9, 2, 4, 3, 0
second period: 3, 2, 3, 1, 3, 4, 2, 4, 3, 1, 0, 2, 3, 1, 2
third period: 4, 5, 3, 4, 2, 3, 4, 1, 8, 2, 3, 1, 0, 2, 1, 3
which is the best measure of center for third period, and why?
interquartile range, because there is 1 outlier that affects the center
standard deviation, because there are no outliers that affect the center
mean, because there are no outliers that affect the center
median, because there is 1 outlier that affects the center
Step1: List third period data
Data: 4, 5, 3, 4, 2, 3, 4, 1, 8, 2, 3, 1, 0, 2, 1, 3
Step2: Sort the data set
Sorted data: 0, 1, 1, 1, 2, 2, 2, 3, 3, 3, 3, 4, 4, 4, 5, 8
Step3: Identify outliers
Calculate quartiles:
$Q_1 = \frac{1+2}{2} = 1.5$
$Q_3 = \frac{4+4}{2} = 4$
IQR = $Q_3 - Q_1 = 4 - 1.5 = 2.5$
Lower bound: $Q_1 - 1.5\times IQR = 1.5 - 3.75 = -2.25$
Upper bound: $Q_3 + 1.5\times IQR = 4 + 3.75 = 7.75$
Value 8 > 7.75, so 8 is an outlier.
Step4: Choose best center measure
Outliers skew the mean, so median (resistant to outliers) is best.

Snap & solve any problem in the app
Get step-by-step solutions on Sovi AI
Photo-based solutions with guided steps
Explore more problems and detailed explanations
Median, because there is 1 outlier that affects the center