QUESTION IMAGE
Question
svlc algebra 1a - standard (15260)
introduction to linear functions
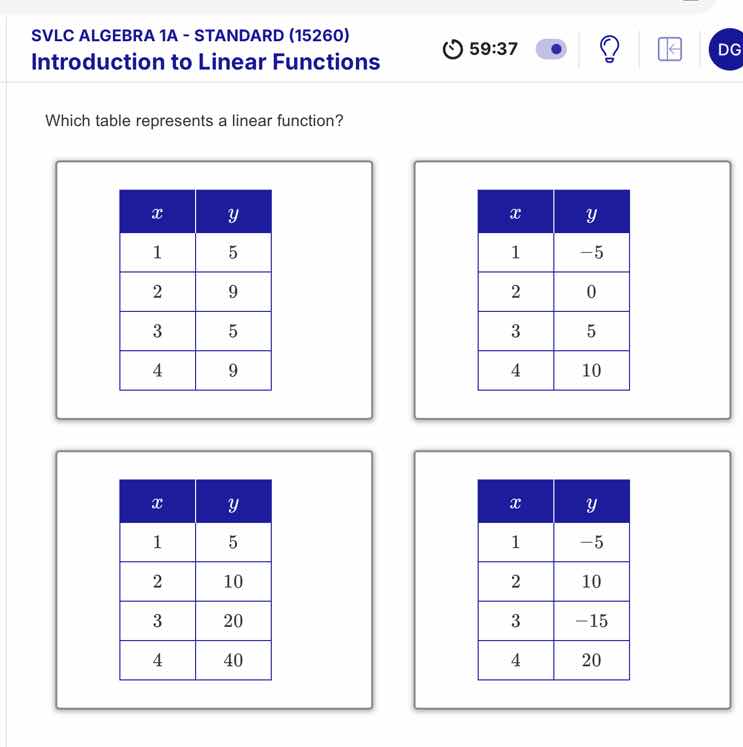
which table represents a linear function?
first table (top left):
| x | y |
|---|---|
| 2 | 9 |
| 3 | 5 |
| 4 | 9 |
second table (top right):
| x | y |
|---|---|
| 2 | 0 |
| 3 | 5 |
| 4 | 10 |
third table (bottom left):
| x | y |
|---|---|
| 2 | 10 |
| 3 | 20 |
| 4 | 40 |
fourth table (bottom right):
| x | y |
|---|---|
| 2 | 10 |
| 3 | -15 |
| 4 | 20 |
Step1: Recall linear function property
A linear function has a constant rate of change (slope), i.e., $\frac{\Delta y}{\Delta x}$ is constant for consecutive $x$ values.
Step2: Analyze first table
For $x$ from 1 to 2: $\Delta y = 9 - 5 = 4$, $\Delta x = 1$, slope $= 4$.
From 2 to 3: $\Delta y = 5 - 9 = -4$, slope $= -4$. Not constant.
Step3: Analyze second table
From 1 to 2: $\Delta y = 0 - (-5) = 5$, $\Delta x = 1$, slope $= 5$.
From 2 to 3: $\Delta y = 5 - 0 = 5$, slope $= 5$.
From 3 to 4: $\Delta y = 10 - 5 = 5$, slope $= 5$. Constant slope.
Step4: Analyze third table
From 1 to 2: $\Delta y = 10 - 5 = 5$, slope $= 5$.
From 2 to 3: $\Delta y = 20 - 10 = 10$, slope $= 10$. Not constant.
Step5: Analyze fourth table
From 1 to 2: $\Delta y = 10 - (-5) = 15$, slope $= 15$.
From 2 to 3: $\Delta y = -15 - 10 = -25$, slope $= -25$. Not constant.

Snap & solve any problem in the app
Get step-by-step solutions on Sovi AI
Photo-based solutions with guided steps
Explore more problems and detailed explanations
The table with \( x \) values 1, 2, 3, 4 and \( y \) values -5, 0, 5, 10 (second table) represents a linear function.