QUESTION IMAGE
Question
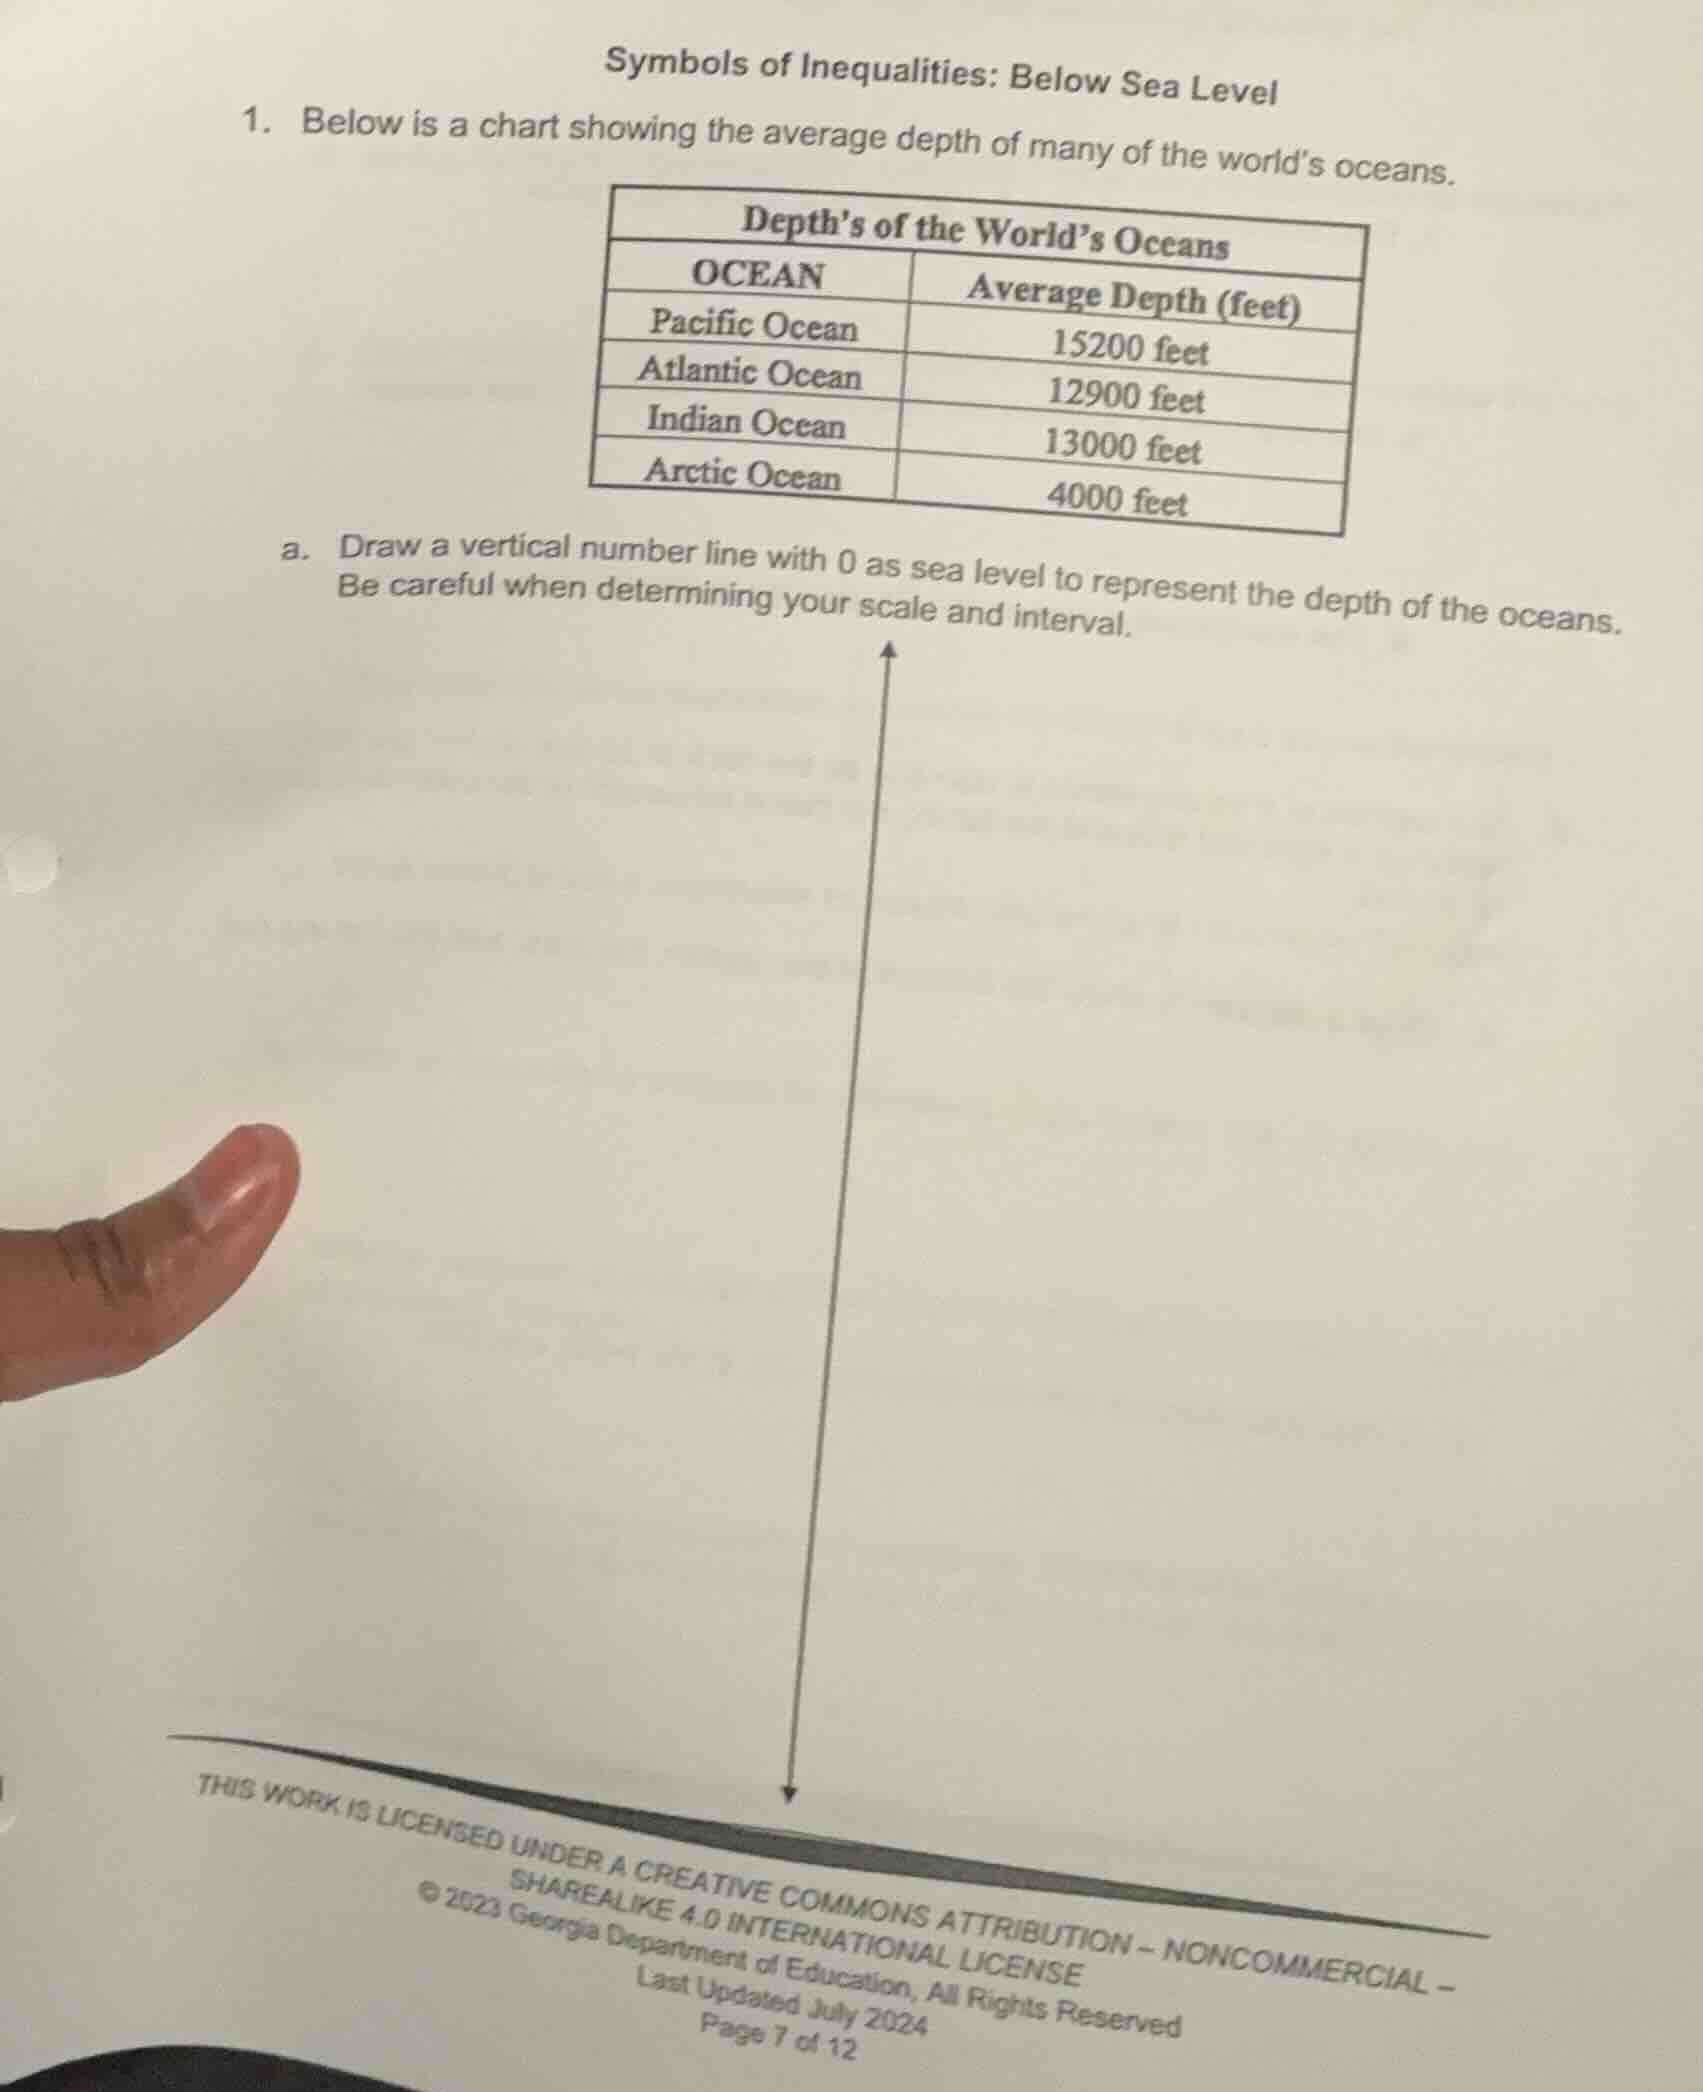
symbols of inequalities: below sea level
- below is a chart showing the average depth of many of the world’s oceans.
depths of the world’s oceans
ocean | average depth (feet)
pacific ocean | 15200 feet
atlantic ocean | 12900 feet
indian ocean | 13000 feet
arctic ocean | 4000 feet
a. draw a vertical number line with 0 as sea level to represent the depth of the oceans. be careful when determining your scale and interval.
this work is licensed under a creative commons attribution - noncommercial - sharealike 4.0 international license
© 2023 georgia department of education, all rights reserved
last updated july 2024
page 7 of 12
Step1: Determine the scale
The maximum depth is 15200 feet (Pacific Ocean), and the minimum is 4000 feet (Arctic Ocean). A reasonable scale could be using intervals of 2000 feet or 5000 feet. Let's choose an interval of 5000 feet for clarity. So the number line will have marks at -5000, -10000, -15000, etc. (since depth below sea level is negative).
Step2: Plot the points
- Pacific Ocean: -15200 feet. Locate -15000 on the number line (since 15200 is close to 15000) and mark the point for Pacific Ocean slightly below -15000.
- Atlantic Ocean: -12900 feet. This is between -10000 and -15000, closer to -13000, so mark it around -13000.
- Indian Ocean: -13000 feet. Mark this at -13000.
- Arctic Ocean: -4000 feet. Mark this at -4000.
Step3: Draw the vertical number line
Draw a vertical line. Label 0 at the top (sea level). Draw horizontal ticks at regular intervals (e.g., every 5000 feet) going downwards. Label the ticks with negative numbers (-5000, -10000, -15000). Then plot the four ocean depths as points on this number line, labeling each point with the ocean name.

Snap & solve any problem in the app
Get step-by-step solutions on Sovi AI
Photo-based solutions with guided steps
Explore more problems and detailed explanations
To draw the vertical number line:
- Draw a vertical line. Label \( 0 \) (sea level) at the top.
- Choose a scale (e.g., interval of \( 5000 \) feet). Mark horizontal ticks downward at \( -5000 \), \( -10000 \), \( -15000 \), etc.
- Plot points:
- Pacific Ocean: Near \( -15000 \) (for \( 15200 \) ft depth).
- Atlantic Ocean: Near \( -13000 \) (for \( 12900 \) ft depth).
- Indian Ocean: At \( -13000 \) (for \( 13000 \) ft depth).
- Arctic Ocean: At \( -4000 \) (for \( 4000 \) ft depth).
- Label each point with the ocean name.
(Note: A hand-drawn or digital sketch following these steps will represent the ocean depths below sea level.)