QUESTION IMAGE
Question
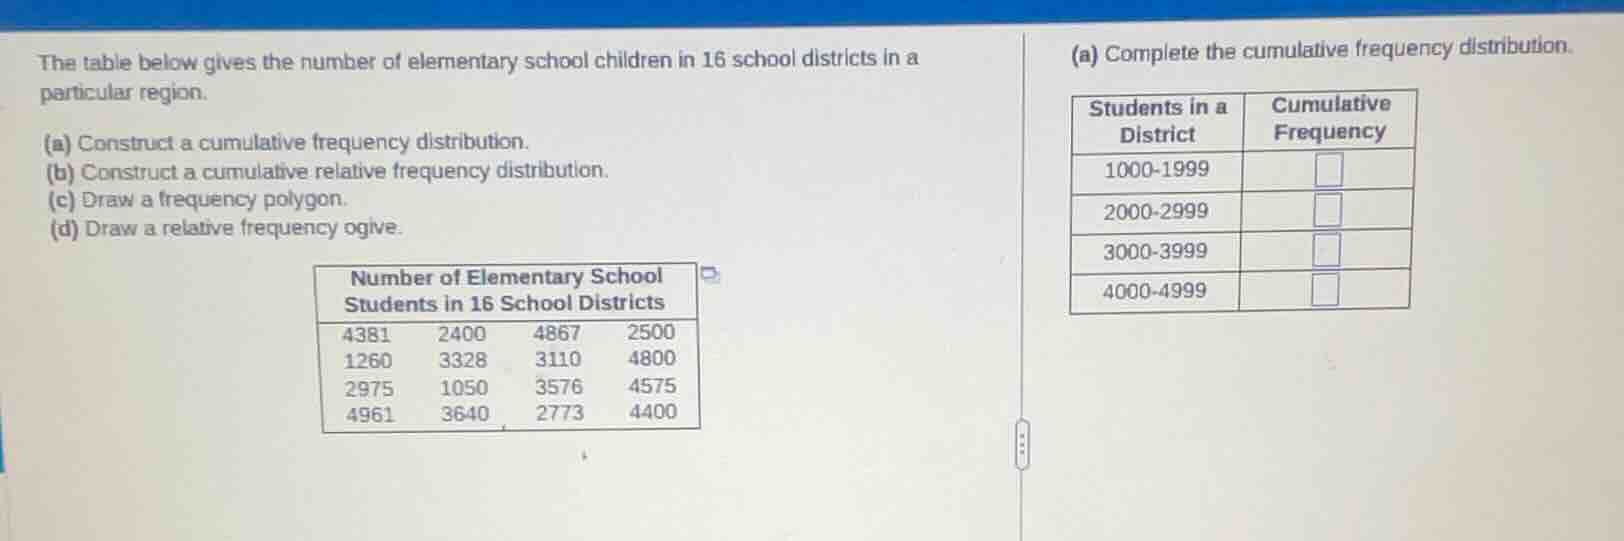
the table below gives the number of elementary school children in 16 school districts in a particular region. (a) construct a cumulative frequency distribution. (b) construct a cumulative relative frequency distribution. (c) draw a frequency polygon. (d) draw a relative frequency ogive. number of elementary school students in 16 school districts 4381 2400 4867 2500 1260 3328 3110 4800 2975 1050 3576 4575 4961 3640 2773 4400 (a) complete the cumulative frequency distribution. students in a district cumulative frequency 1000 - 1999 2000 - 2999 3000 - 3999 4000 - 4999
To solve part (a) of constructing the cumulative frequency distribution, we first need to determine the frequency (number of data points) in each class interval and then calculate the cumulative frequency.
Step 1: Determine the frequency for each class interval
We have the following class intervals: \(1000 - 1999\), \(2000 - 2999\), \(3000 - 3999\), and \(4000 - 4999\). We will count how many data points fall into each interval.
The data points are: \(4381, 2400, 4867, 2500, 1260, 3328, 3110, 4800, 2975, 1050, 3576, 4575, 4961, 3640, 2773, 4400\) (Wait, the original table says 16 school districts. Let's count the data points:
First row: \(4381, 2400, 4867, 2500\) (4)
Second row: \(1260, 3328, 3110, 4800\) (4)
Third row: \(2975, 1050, 3576, 4575\) (4)
Fourth row: \(4961, 3640, 2773, 4400\) (4)
Total: \(4 + 4 + 4 + 4 = 16\), which matches.
Now, let's classify each data point:
- Class \(1000 - 1999\): Data points between 1000 (inclusive) and 1999 (inclusive). The data points are \(1260, 1050\). So frequency \(f_1 = 2\).
- Class \(2000 - 2999\): Data points between 2000 (inclusive) and 2999 (inclusive). The data points are \(2400, 2500, 2975, 2773\). So frequency \(f_2 = 4\).
- Class \(3000 - 3999\): Data points between 3000 (inclusive) and 3999 (inclusive). The data points are \(3328, 3110, 3576, 3640\). So frequency \(f_3 = 4\).
- Class \(4000 - 4999\): Data points between 4000 (inclusive) and 4999 (inclusive). The data points are \(4381, 4867, 4800, 4575, 4961, 4400\). Wait, let's count: \(4381, 4867, 4800, 4575, 4961, 4400\) – that's 6? Wait, no, let's list all:
Wait, the data points are:
- \(4381\) – 4000-4999
- \(2400\) – 2000-2999
- \(4867\) – 4000-4999
- \(2500\) – 2000-2999
- \(1260\) – 1000-1999
- \(3328\) – 3000-3999
- \(3110\) – 3000-3999
- \(4800\) – 4000-4999
- \(2975\) – 2000-2999
- \(1050\) – 1000-1999
- \(3576\) – 3000-3999
- \(4575\) – 4000-4999
- \(4961\) – 4000-4999
- \(3640\) – 3000-3999
- \(2773\) – 2000-2999
- \(4400\) – 4000-4999
Now let's count again:
- \(1000 - 1999\): \(1260, 1050\) → 2 (correct, \(f_1 = 2\))
- \(2000 - 2999\): \(2400, 2500, 2975, 2773\) → 4 (correct, \(f_2 = 4\))
- \(3000 - 3999\): \(3328, 3110, 3576, 3640\) → 4 (correct, \(f_3 = 4\))
- \(4000 - 4999\): \(4381, 4867, 4800, 4575, 4961, 4400\) → 6 (Wait, 16 total: \(2 + 4 + 4 + 6 = 16\), yes. I must have miscounted earlier. Let's confirm:
Data points in 4000-4999:
- \(4381\)
- \(4867\)
- \(4800\)
- \(4575\)
- \(4961\)
- \(4400\)
That's 6 data points. So \(f_4 = 6\).
Step 2: Calculate cumulative frequency
Cumulative frequency for a class is the sum of the frequencies of that class and all previous classes.
- For \(1000 - 1999\): Cumulative frequency \(CF_1 = f_1 = 2\)
- For \(2000 - 2999\): Cumulative frequency \(CF_2 = f_1 + f_2 = 2 + 4 = 6\)
- For \(3000 - 3999\): Cumulative frequency \(CF_3 = f_1 + f_2 + f_3 = 2 + 4 + 4 = 10\)
- For \(4000 - 4999\): Cumulative frequency \(CF_4 = f_1 + f_2 + f_3 + f_4 = 2 + 4 + 4 + 6 = 16\) (which makes sense, as there are 16 total data points)
Now, we can complete the cumulative frequency distribution table:
| Students in a District | Cumulative Frequency |
|---|---|
| \(2000 - 2999\) | \(6\) |
| \(3000 - 3999\) | \(10\) |
| \(4000 - 4999\) | \(16\) |
Final Answer for part (a)
The cumulative frequency distribution is as follows:
| Students in a Distr…

Snap & solve any problem in the app
Get step-by-step solutions on Sovi AI
Photo-based solutions with guided steps
Explore more problems and detailed explanations
To solve part (a) of constructing the cumulative frequency distribution, we first need to determine the frequency (number of data points) in each class interval and then calculate the cumulative frequency.
Step 1: Determine the frequency for each class interval
We have the following class intervals: \(1000 - 1999\), \(2000 - 2999\), \(3000 - 3999\), and \(4000 - 4999\). We will count how many data points fall into each interval.
The data points are: \(4381, 2400, 4867, 2500, 1260, 3328, 3110, 4800, 2975, 1050, 3576, 4575, 4961, 3640, 2773, 4400\) (Wait, the original table says 16 school districts. Let's count the data points:
First row: \(4381, 2400, 4867, 2500\) (4)
Second row: \(1260, 3328, 3110, 4800\) (4)
Third row: \(2975, 1050, 3576, 4575\) (4)
Fourth row: \(4961, 3640, 2773, 4400\) (4)
Total: \(4 + 4 + 4 + 4 = 16\), which matches.
Now, let's classify each data point:
- Class \(1000 - 1999\): Data points between 1000 (inclusive) and 1999 (inclusive). The data points are \(1260, 1050\). So frequency \(f_1 = 2\).
- Class \(2000 - 2999\): Data points between 2000 (inclusive) and 2999 (inclusive). The data points are \(2400, 2500, 2975, 2773\). So frequency \(f_2 = 4\).
- Class \(3000 - 3999\): Data points between 3000 (inclusive) and 3999 (inclusive). The data points are \(3328, 3110, 3576, 3640\). So frequency \(f_3 = 4\).
- Class \(4000 - 4999\): Data points between 4000 (inclusive) and 4999 (inclusive). The data points are \(4381, 4867, 4800, 4575, 4961, 4400\). Wait, let's count: \(4381, 4867, 4800, 4575, 4961, 4400\) – that's 6? Wait, no, let's list all:
Wait, the data points are:
- \(4381\) – 4000-4999
- \(2400\) – 2000-2999
- \(4867\) – 4000-4999
- \(2500\) – 2000-2999
- \(1260\) – 1000-1999
- \(3328\) – 3000-3999
- \(3110\) – 3000-3999
- \(4800\) – 4000-4999
- \(2975\) – 2000-2999
- \(1050\) – 1000-1999
- \(3576\) – 3000-3999
- \(4575\) – 4000-4999
- \(4961\) – 4000-4999
- \(3640\) – 3000-3999
- \(2773\) – 2000-2999
- \(4400\) – 4000-4999
Now let's count again:
- \(1000 - 1999\): \(1260, 1050\) → 2 (correct, \(f_1 = 2\))
- \(2000 - 2999\): \(2400, 2500, 2975, 2773\) → 4 (correct, \(f_2 = 4\))
- \(3000 - 3999\): \(3328, 3110, 3576, 3640\) → 4 (correct, \(f_3 = 4\))
- \(4000 - 4999\): \(4381, 4867, 4800, 4575, 4961, 4400\) → 6 (Wait, 16 total: \(2 + 4 + 4 + 6 = 16\), yes. I must have miscounted earlier. Let's confirm:
Data points in 4000-4999:
- \(4381\)
- \(4867\)
- \(4800\)
- \(4575\)
- \(4961\)
- \(4400\)
That's 6 data points. So \(f_4 = 6\).
Step 2: Calculate cumulative frequency
Cumulative frequency for a class is the sum of the frequencies of that class and all previous classes.
- For \(1000 - 1999\): Cumulative frequency \(CF_1 = f_1 = 2\)
- For \(2000 - 2999\): Cumulative frequency \(CF_2 = f_1 + f_2 = 2 + 4 = 6\)
- For \(3000 - 3999\): Cumulative frequency \(CF_3 = f_1 + f_2 + f_3 = 2 + 4 + 4 = 10\)
- For \(4000 - 4999\): Cumulative frequency \(CF_4 = f_1 + f_2 + f_3 + f_4 = 2 + 4 + 4 + 6 = 16\) (which makes sense, as there are 16 total data points)
Now, we can complete the cumulative frequency distribution table:
| Students in a District | Cumulative Frequency |
|---|---|
| \(2000 - 2999\) | \(6\) |
| \(3000 - 3999\) | \(10\) |
| \(4000 - 4999\) | \(16\) |
Final Answer for part (a)
The cumulative frequency distribution is as follows:
| Students in a District | Cumulative Frequency |
|---|---|
| \(2000 - 2999\) | \(6\) |
| \(3000 - 3999\) | \(10\) |
| \(4000 - 4999\) | \(16\) |
For part (b), the cumulative relative frequency is calculated by dividing the cumulative frequency by the total number of data points (which is 16).
Step 1: Calculate cumulative relative frequency for each class
- For \(1000 - 1999\): \(\frac{2}{16} = 0.125\)
- For \(2000 - 2999\): \(\frac{6}{16} = 0.375\)
- For \(3000 - 3999\): \(\frac{10}{16} = 0.625\)
- For \(4000 - 4999\): \(\frac{16}{16} = 1.0\)
So the cumulative relative frequency distribution is:
| Students in a District | Cumulative Relative Frequency |
|---|---|
| \(2000 - 2999\) | \(0.375\) |
| \(3000 - 3999\) | \(0.625\) |
| \(4000 - 4999\) | \(1.0\) |
Final Answer for part (b)
The cumulative relative frequency distribution is as follows:
| Students in a District | Cumulative Relative Frequency |
|---|---|
| \(2000 - 2999\) | \(0.375\) |
| \(3000 - 3999\) | \(0.625\) |
| \(4000 - 4999\) | \(1.0\) |
For parts (c) and (d), since they involve drawing graphs, we can describe the process:
Part (c): Frequency Polygon
A frequency polygon is constructed by plotting the midpoints of each class interval on the x-axis and the frequency on the y-axis, then connecting the points with straight lines.
- Midpoints of class intervals:
- \(1000 - 1999\): Midpoint \(= \frac{1000 + 1999}{2} = 1499.5\)
- \(2000 - 2999\): Midpoint \(= \frac{2000 + 2999}{2} = 2499.5\)
- \(3000 - 3999\): Midpoint \(= \frac{3000 + 3999}{2} = 3499.5\)
- \(4000 - 4999\): Midpoint \(= \frac{4000 + 4999}{2} = 4499.5\)
- Frequencies:
- \(1000 - 1999\): \(2\)
- \(2000 - 2999\): \(4\)
- \(3000 - 3999\): \(4\)
- \(4000 - 4999\): \(6\)
- Plotting: Plot the points \((1499.5, 2)\), \((2499.5, 4)\), \((3499.5, 4)\), \((4499.5, 6)\) and connect them with straight lines. Extend the polygon to the left (before the first midpoint) and right (after the last midpoint) to the x-axis to complete the polygon.
Part (d): Relative Frequency Ogive
A relative frequency ogive is constructed by plotting the upper class boundaries on the x-axis and the cumulative relative frequency on the y-axis, then connecting the points with straight lines.
- Upper class boundaries:
- \(1000 - 1999\): Upper boundary \(= 1999.5\) (assuming continuous data, so we use \(1999.5\) instead of \(1999\))
- \(2000 - 2999\): Upper boundary \(= 2999.5\)
- \(3000 - 3999\): Upper boundary \(= 3999.5\)
- \(4000 - 4999\): Upper boundary \(= 4999.5\)
- Cumulative relative frequencies:
- \(1000 - 1999\): \(0.125\) (at upper boundary \(1999.5\))
- \(2000 - 2999\): \(0.375\) (at upper boundary \(2999.5\))
- \(3000 - 3999\): \(0.625\) (at upper boundary \(3999.5\))
- \(4000 - 4999\): \(1.0\) (at upper boundary \(4999.5\))
- Plotting: Plot the points \((1999.5, 0.125)\), \((2999.5, 0.375)\), \((3999.5, 0.625)\), \((4999.5, 1.0)\) and connect them with straight lines. Start the ogive at the lower boundary of the first class (with cumulative relative frequency 0) and end at the upper boundary of the last class.
Final Answers
(a) Cumulative frequency distribution:
| Students in a District | Cumulative Frequency |
|---|---|
| \(2000 - 2999\) | \(6\) |
| \(3000 - 3999\) | \(10\) |
| \(4000 - 4999\) | \(16\) |
(b) Cumulative relative frequency distribution:
| Students in a District | Cumulative Relative Frequency |
|---|---|
| \(2000 - 2999\) | \(0.375\) |
| \(3000 - 3999\) | \(0.625\) |
| \(4000 - 4999\) | \(1.0\) |
(c) Frequency polygon: Plot the midpoints and connect the points as described.
(d) Relative frequency ogive: Plot the upper class boundaries and cumulative relative frequencies as described.