QUESTION IMAGE
Question
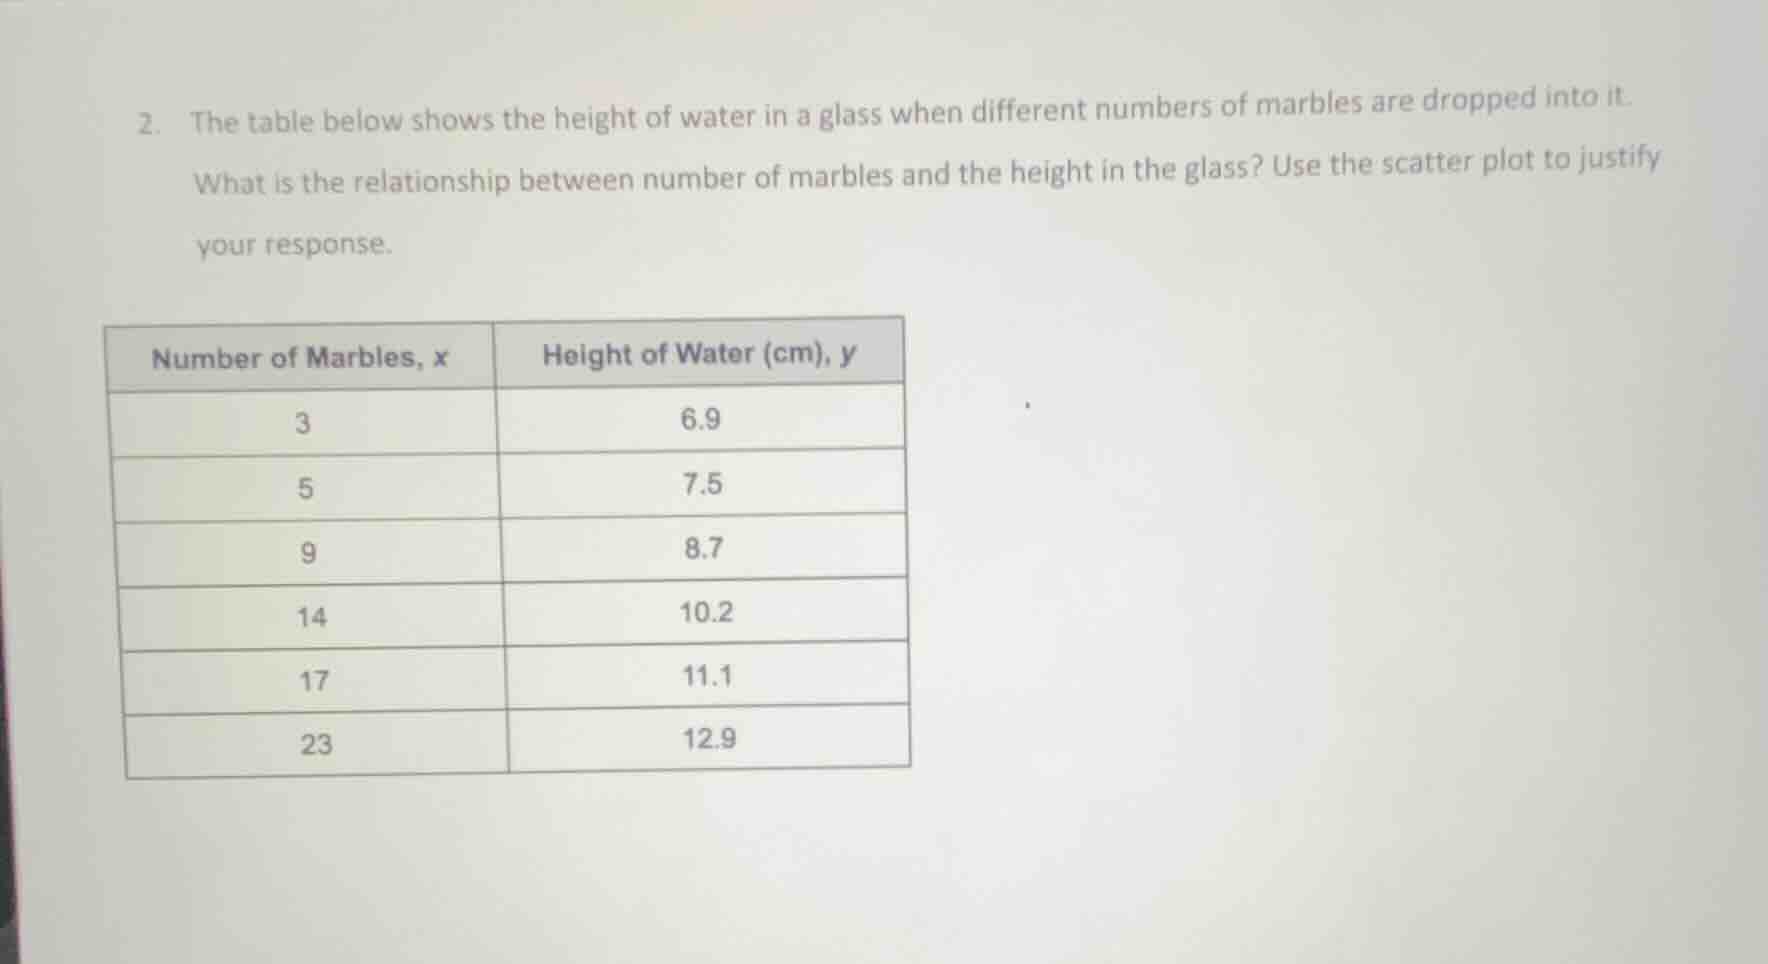
- the table below shows the height of water in a glass when different numbers of marbles are dropped into it. what is the relationship between number of marbles and the height in the glass? use the scatter plot to justify your response.
number of marbles, x | height of water (cm), y
3 | 6.9
5 | 7.5
9 | 8.7
14 | 10.2
17 | 11.1
23 | 12.9
Step1: Analyze the trend of x and y
As the number of marbles (\(x\)) increases (from 3 to 23), the height of water (\(y\)) also increases (from 6.9 cm to 12.9 cm).
Step2: Check the linearity
To check if it's a linear relationship, we can calculate the slope between consecutive points. For example, between \(x = 3,y = 6.9\) and \(x = 5,y = 7.5\), the slope \(m=\frac{7.5 - 6.9}{5 - 3}=\frac{0.6}{2}=0.3\). Between \(x = 5,y = 7.5\) and \(x = 9,y = 8.7\), the slope \(m=\frac{8.7 - 7.5}{9 - 5}=\frac{1.2}{4}=0.3\). The slope is approximately constant, indicating a linear relationship.
Step3: Justify with scatter plot idea
If we were to plot these points (\((3,6.9)\), \((5,7.5)\), \((9,8.7)\), \((14,10.2)\), \((17,11.1)\), \((23,12.9)\)) on a scatter plot, the points would lie close to a straight line with a positive slope. This shows a strong positive linear relationship between the number of marbles and the height of water.

Snap & solve any problem in the app
Get step-by-step solutions on Sovi AI
Photo-based solutions with guided steps
Explore more problems and detailed explanations
There is a strong positive linear relationship between the number of marbles and the height of water in the glass. As the number of marbles increases, the height of water increases, and the points would lie close to a straight line when plotted on a scatter plot (the slope between consecutive points is approximately constant, e.g., around \(0.3\) as calculated), indicating a linear trend.