QUESTION IMAGE
Question
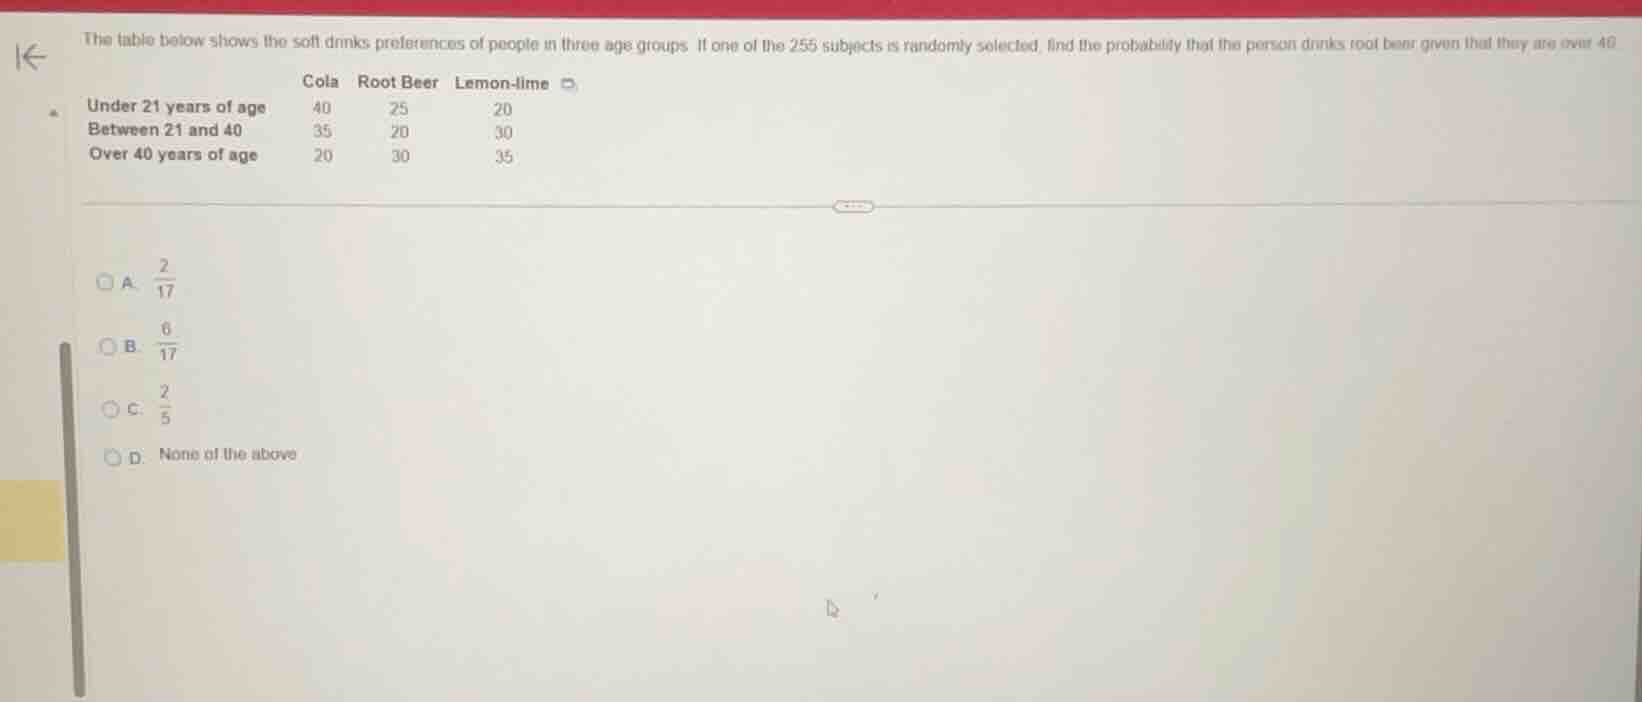
the table below shows the soft drinks preferences of people in three age groups. if one of the 255 subjects is randomly selected, find the probability that the person drinks root beer given that they are over 40.cola root beer lemon-limeunder 21 years of age 40 25 20between 21 and 40 35 20 30over 40 years of age 20 30 35a. $\frac{2}{17}$b. $\frac{6}{17}$c. $\frac{2}{5}$d. none of the above
Step1: Find total people over 40
Add the counts for over 40 age group: $20 + 30 + 35 = 85$
Step2: Identify root beer drinkers over 40
From the table, this value is $30$
Step3: Calculate conditional probability
Divide root beer count by total over 40: $\frac{30}{85} = \frac{6}{17}$

Snap & solve any problem in the app
Get step-by-step solutions on Sovi AI
Photo-based solutions with guided steps
Explore more problems and detailed explanations
B. $\frac{6}{17}$