QUESTION IMAGE
Question
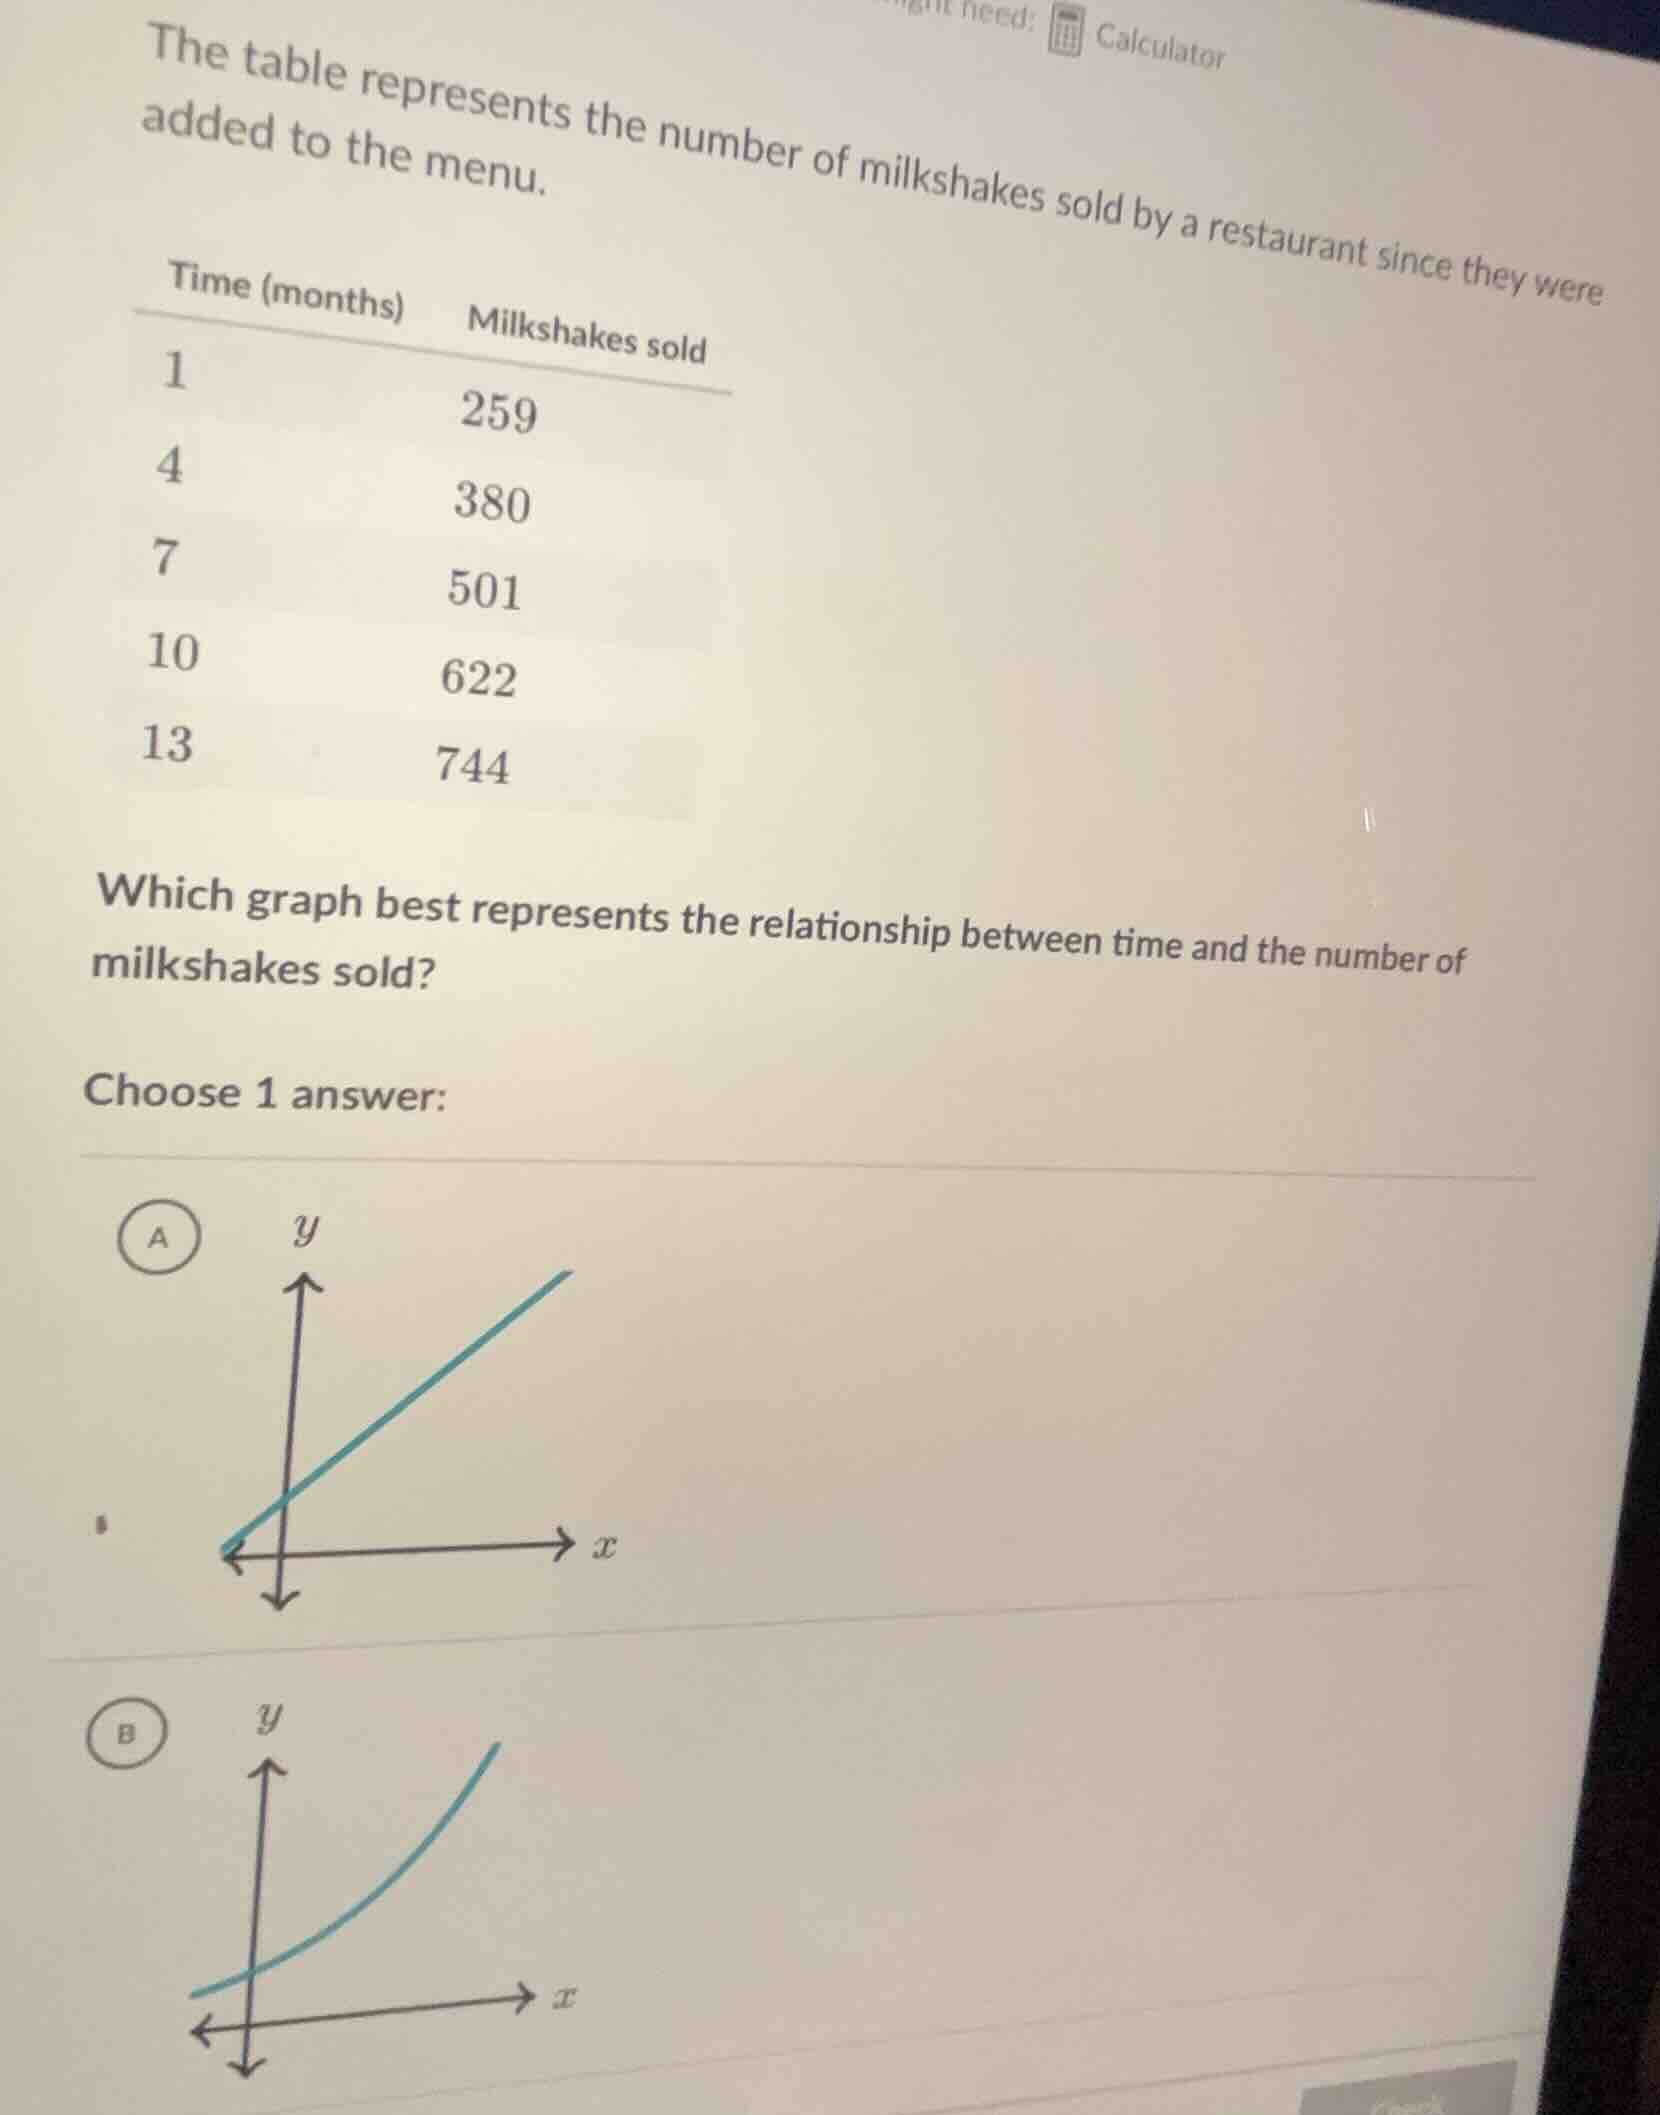
the table represents the number of milkshakes sold by a restaurant since they were added to the menu.
| time (months) | milkshakes sold |
|---|---|
| 4 | 380 |
| 7 | 501 |
| 10 | 622 |
| 13 | 744 |
which graph best represents the relationship between time and the number of milkshakes sold?
choose 1 answer:
a. graph of a straight line with positive slope
b. graph of a curve with increasing slope
Step1: Check rate of change
Calculate the difference in milkshakes sold and time between consecutive data points:
- $\Delta x_1 = 4-1=3$, $\Delta y_1=380-259=121$
- $\Delta x_2 = 7-4=3$, $\Delta y_2=501-380=121$
- $\Delta x_3 = 10-7=3$, $\Delta y_3=622-501=121$
- $\Delta x_4 = 13-10=3$, $\Delta y_4=744-622=122$ (near constant, minor rounding)
Step2: Identify relationship type
Since the change in $y$ (milkshakes sold) is nearly constant for each equal change in $x$ (time), the relationship is linear. A linear relationship is represented by a straight line graph.

Snap & solve any problem in the app
Get step-by-step solutions on Sovi AI
Photo-based solutions with guided steps
Explore more problems and detailed explanations
A. A straight line graph with positive slope starting above the origin