QUESTION IMAGE
Question
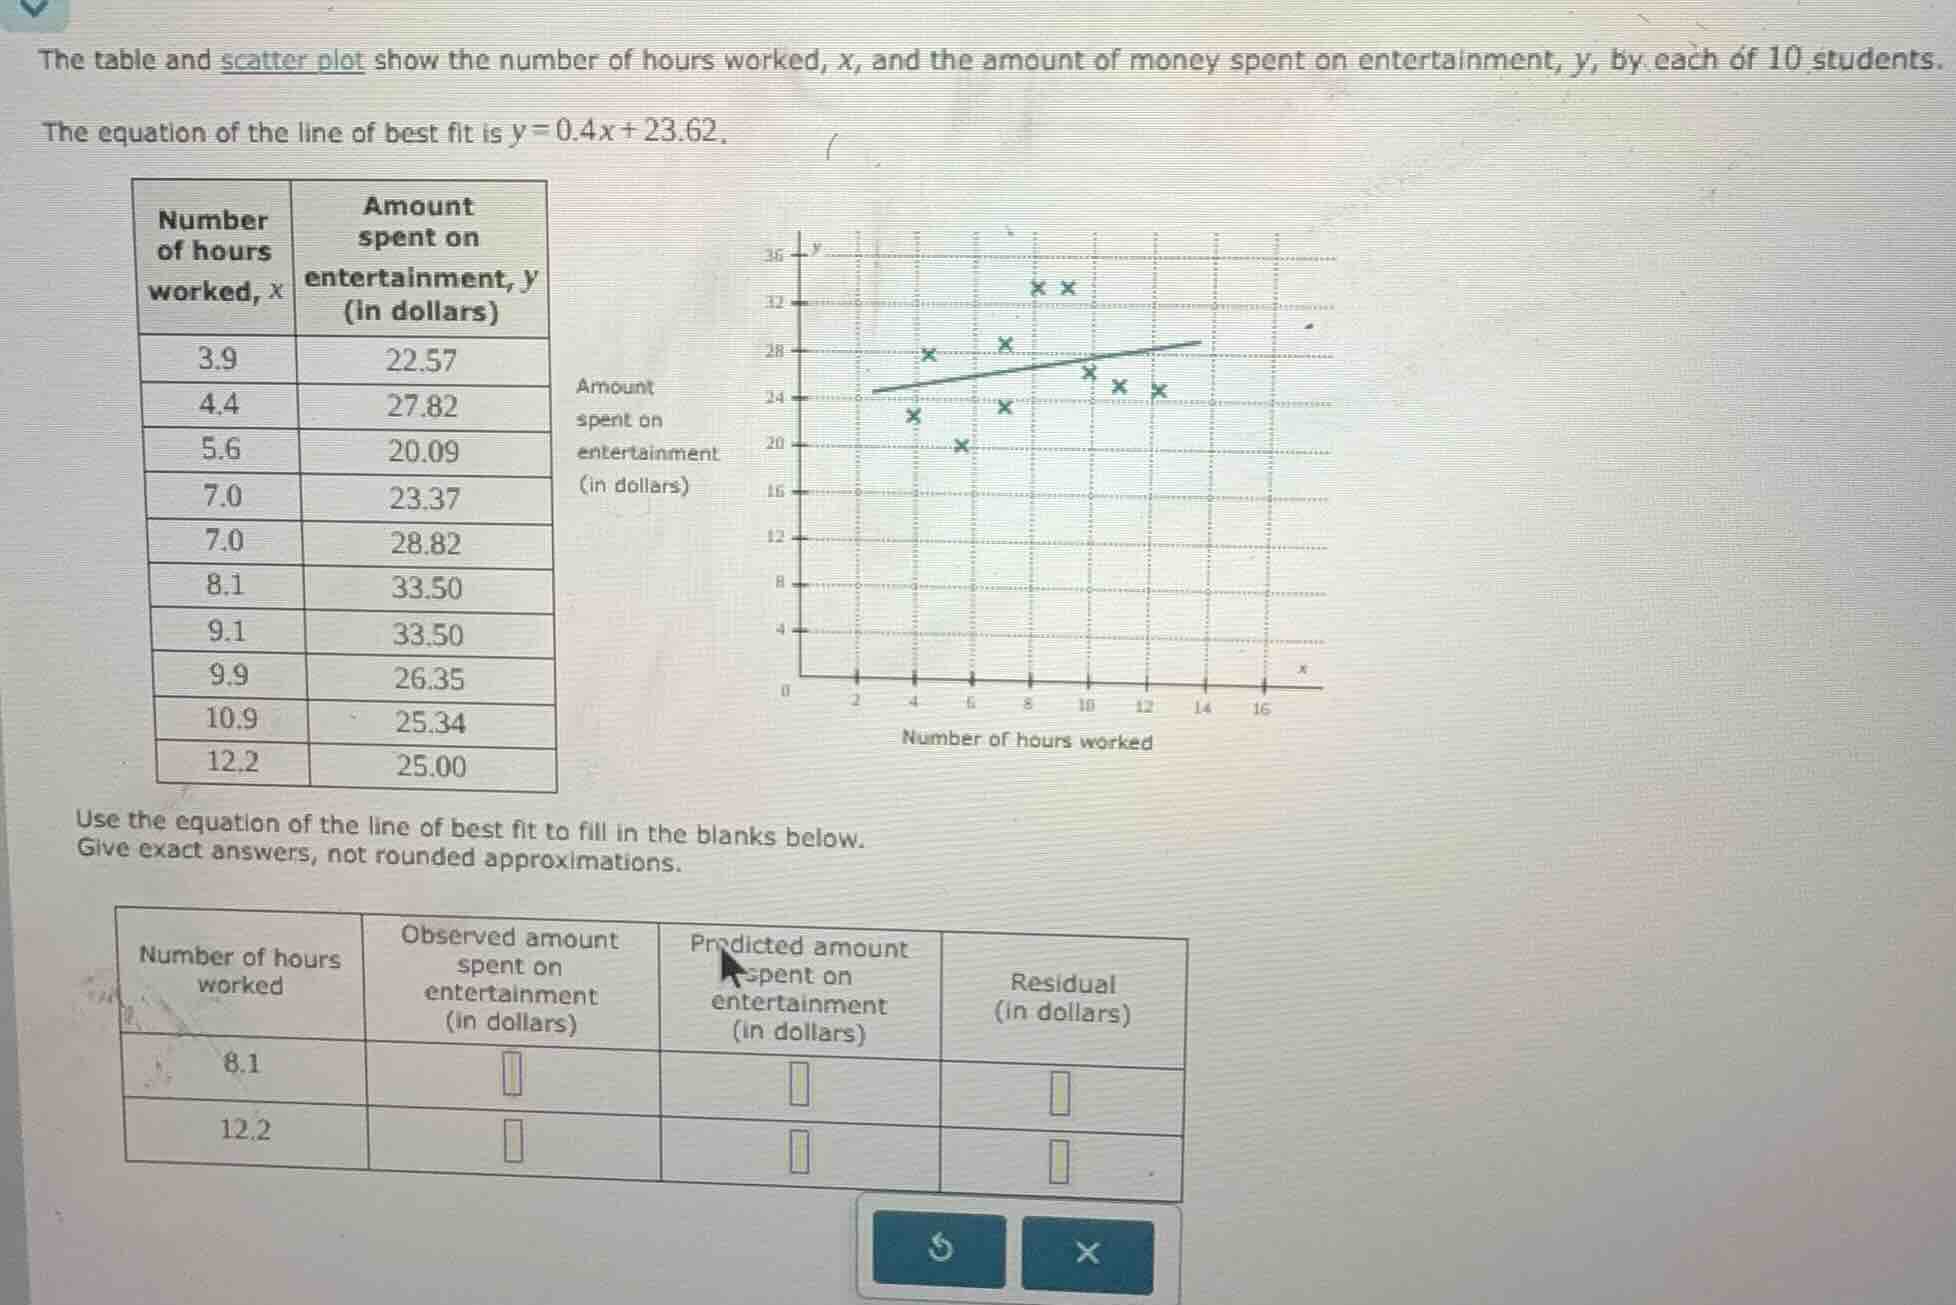
the table and scatter plot show the number of hours worked, x, and the amount of money spent on entertainment, y, by each of 10 students. the equation of the line of best fit is y = 0.4x + 23.62. table and scatter plot data as shown use the equation of the line of best fit to fill in the blanks below. give exact answers, not rounded approximations. table with rows for 8.1 and 12.2 hours worked, columns for observed amount, predicted amount, residual
Step1: Get observed values from table
For $x=8.1$, observed $y=33.50$; for $x=12.2$, observed $y=25.00$
Step2: Calculate predicted $y$ for $x=8.1$
Substitute $x=8.1$ into $y=0.4x+23.62$
Step3: Calculate residual for $x=8.1$
Residual = Observed - Predicted
$33.50 - 26.86 = 6.64$
Step4: Calculate predicted $y$ for $x=12.2$
Substitute $x=12.2$ into $y=0.4x+23.62$
Step5: Calculate residual for $x=12.2$
Residual = Observed - Predicted
$25.00 - 28.50 = -3.50$

Snap & solve any problem in the app
Get step-by-step solutions on Sovi AI
Photo-based solutions with guided steps
Explore more problems and detailed explanations
| Number of hours worked | Observed amount spent on entertainment (in dollars) | Predicted amount spent on entertainment (in dollars) | Residual (in dollars) |
|---|---|---|---|
| 12.2 | 25.00 | 28.50 | -3.50 |