QUESTION IMAGE
Question
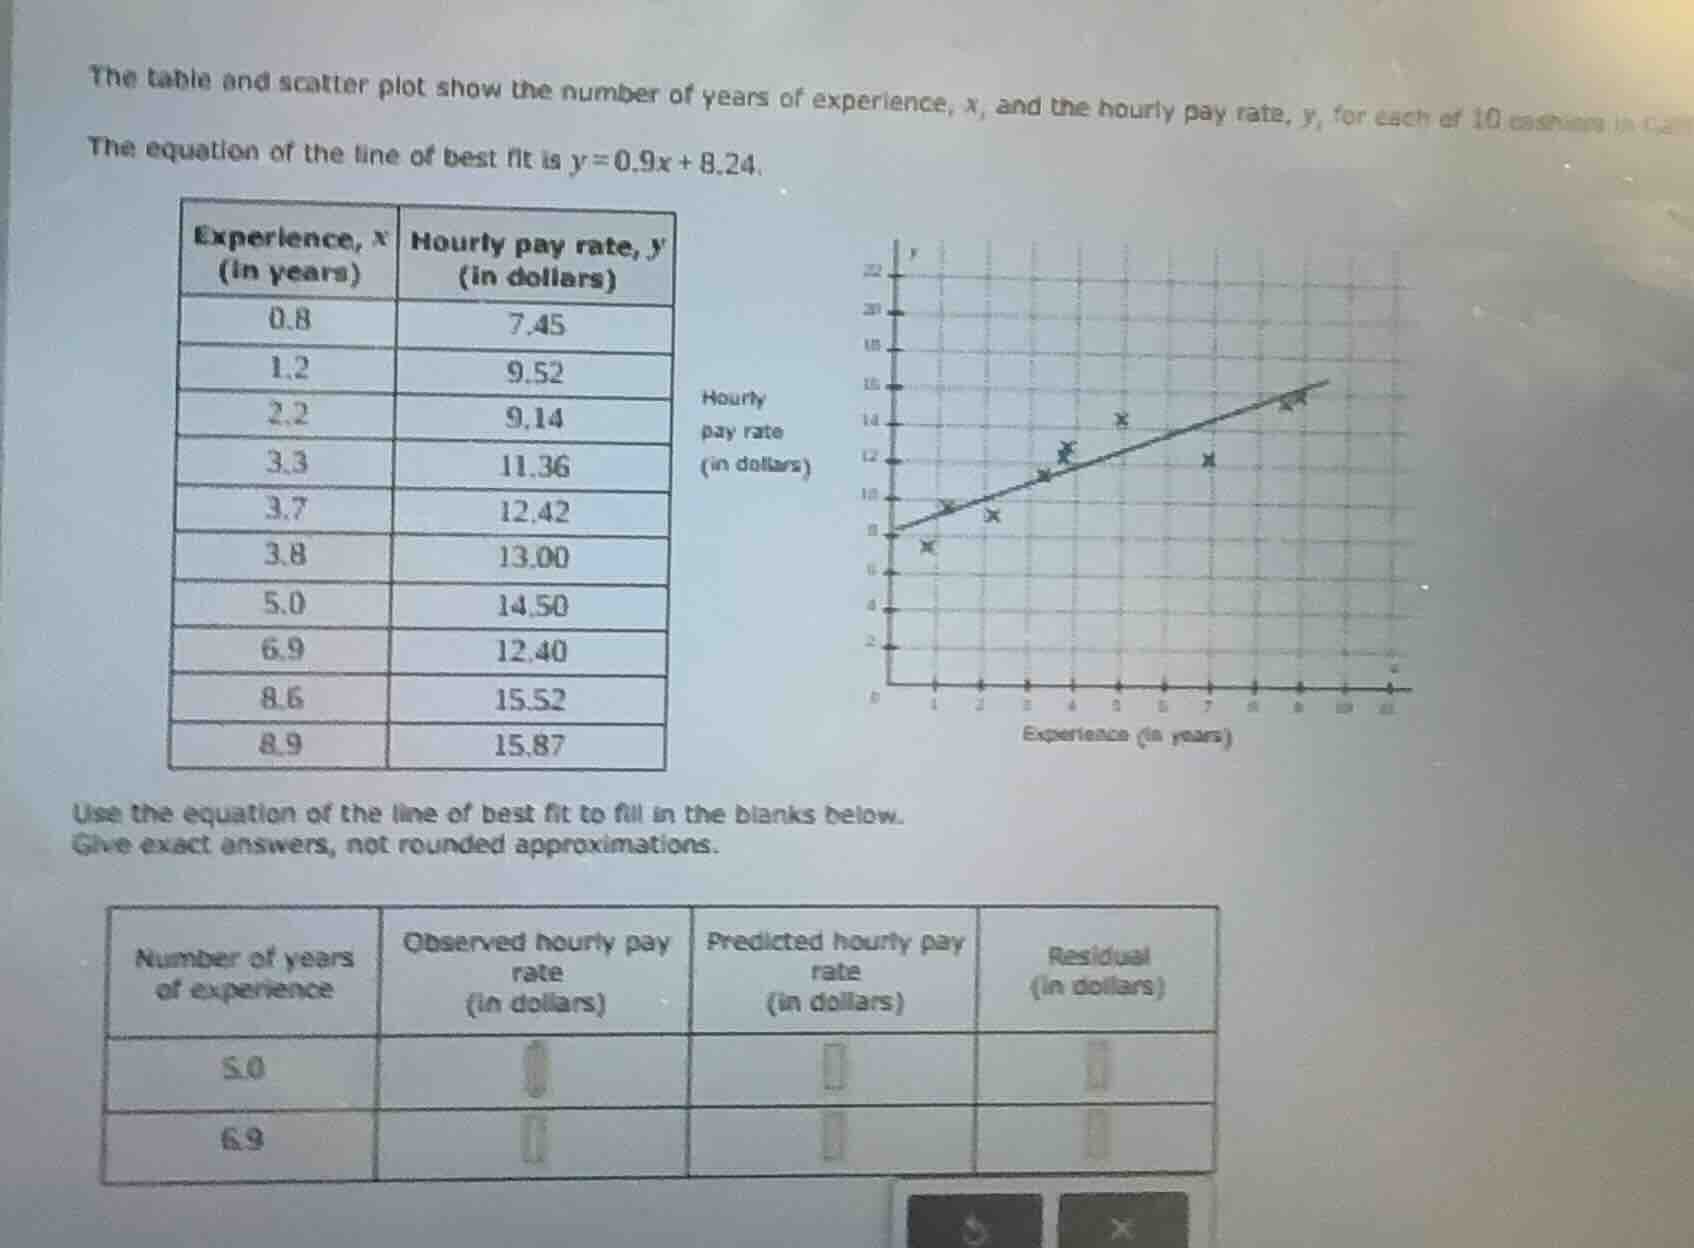
the table and scatter plot show the number of years of experience, $x$, and the hourly pay rate, $y$, for each of 10 cashiers.the equation of the line of best fit is $y=0.9x + 8.24$.| experience, $x$ (in years) | hourly pay rate, $y$ (in dollars) || ---- | ---- || 0.8 | 7.45 || 1.2 | 9.52 || 2.2 | 9.14 || 3.3 | 11.36 || 3.7 | 12.42 || 3.8 | 13.00 || 5.0 | 14.50 || 6.9 | 12.40 || 8.6 | 15.52 || 8.9 | 15.87 |use the equation of the line of best fit to fill in the blanks below.give exact answers, not rounded approximations.| number of years of experience | observed hourly pay rate (in dollars) | predicted hourly pay rate (in dollars) | residual (in dollars) || ---- | ---- | ---- | ---- || 5.0 | | | || 6.9 | | | |
Step1: Extract observed pay rates
From the first table:
- For $x=5.0$, observed $y=14.50$
- For $x=6.9$, observed $y=12.40$
Step2: Calculate predicted pay for $x=5.0$
Substitute $x=5.0$ into $y=0.9x+8.24$
Step3: Calculate residual for $x=5.0$
Residual = Observed - Predicted
$14.50 - 12.74 = 1.76$
Step4: Calculate predicted pay for $x=6.9$
Substitute $x=6.9$ into $y=0.9x+8.24$
Step5: Calculate residual for $x=6.9$
Residual = Observed - Predicted
$12.40 - 14.45 = -2.05$

Snap & solve any problem in the app
Get step-by-step solutions on Sovi AI
Photo-based solutions with guided steps
Explore more problems and detailed explanations
| Number of years of experience | Observed hourly pay rate (in dollars) | Predicted hourly pay rate (in dollars) | Residual (in dollars) |
|---|---|---|---|
| 6.9 | 12.40 | 14.45 | -2.05 |