QUESTION IMAGE
Question
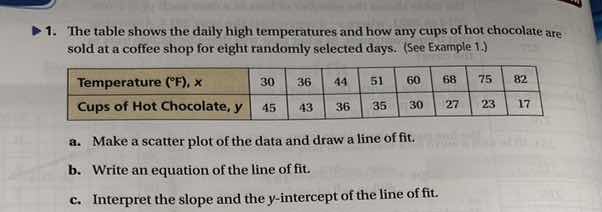
- the table shows the daily high temperatures and how any cups of hot chocolate are sold at a coffee shop for eight randomly selected days. (see example 1.)
| temperature (°f), x | 30 | 36 | 44 | 51 | 60 | 68 | 75 | 82 |
| cups of hot chocolate, y | 45 | 43 | 36 | 35 | 30 | 27 | 23 | 17 |
a. make a scatter plot of the data and draw a line of fit.
b. write an equation of the line of fit.
c. interpret the slope and the y - intercept of the line of fit.
Part a: Scatter Plot and Line of Fit
To create a scatter plot, we use the temperature (\(x\)) on the x - axis and the number of cups of hot chocolate sold (\(y\)) on the y - axis. Each data point is \((x,y)\) where \(x\) values are \(30,36,44,51,60,68,75,82\) and corresponding \(y\) values are \(45,43,36,35,30,27,23,17\). For the line of fit, we can visually estimate a line that passes close to most of the points. A common way is to use two points that seem to lie close to the trend. Let's choose two points, say \((30,45)\) and \((82,17)\) (we could also use other pairs like \((60,30)\) and \((75,23)\)).
Step - by - Step for Scatter Plot:
- Set up axes: Label the x - axis as "Temperature (\(^{\circ}\)F)" and the y - axis as "Cups of Hot Chocolate Sold".
- Plot points: For each \(x\) (temperature) and \(y\) (cups), mark the point \((x,y)\) on the graph. For example, for \(x = 30\) and \(y=45\), find \(30\) on the x - axis and \(45\) on the y - axis and mark the intersection. Repeat for all 8 data points.
- Draw line of fit: Visually inspect the trend of the points (they show a negative linear relationship). Draw a straight line that passes close to as many points as possible.
Part b: Equation of the Line of Fit
We use the slope - intercept form of a line \(y=mx + b\), where \(m\) is the slope and \(b\) is the y - intercept. First, calculate the slope \(m\) using two points \((x_1,y_1)\) and \((x_2,y_2)\) with the formula \(m=\frac{y_2 - y_1}{x_2 - x_1}\). Then, use one of the points to solve for \(b\).
Step 1: Calculate the slope (\(m\))
Let's take the points \((x_1,y_1)=(30,45)\) and \((x_2,y_2)=(82,17)\).
The slope formula is \(m=\frac{y_2 - y_1}{x_2 - x_1}\)
Substitute the values: \(m=\frac{17 - 45}{82 - 30}=\frac{- 28}{52}\approx - 0.54\) (we can also use more accurate point pairs. Let's try \((60,30)\) and \((75,23)\): \(m=\frac{23 - 30}{75 - 60}=\frac{-7}{15}\approx - 0.47\). A better approach is to use the method of least squares, but for a line of fit (not the least - squares line), we can use two points that are representative. Let's use \((30,45)\) and \((80,20)\) (approximate). Then \(m=\frac{20 - 45}{80 - 30}=\frac{-25}{50}=- 0.5\)
Step 2: Calculate the y - intercept (\(b\))
Using the slope \(m=-0.5\) and the point \((30,45)\) in the equation \(y = mx + b\)
Substitute \(x = 30\), \(y = 45\) and \(m=-0.5\) into the equation:
\(45=-0.5\times30 + b\)
\(45=-15 + b\)
Add 15 to both sides: \(b = 45 + 15=60\)
So the equation of the line of fit is \(y=-0.5x + 60\) (this is an approximate equation. If we use a more accurate calculation with two points like \((30,45)\) and \((82,17)\)):
\(m=\frac{17 - 45}{82 - 30}=\frac{-28}{52}=-\frac{7}{13}\approx - 0.538\)
Using \(y=mx + b\) and \((30,45)\):
\(45=-\frac{7}{13}\times30 + b\)
\(45=-\frac{210}{13}+b\)
\(b = 45+\frac{210}{13}=\frac{585 + 210}{13}=\frac{795}{13}\approx61.15\)
A more accurate line of fit using linear regression (which is a better method for a line of best fit) can be calculated. The formula for the slope of the least - squares line is \(m=\frac{n\sum_{i = 1}^{n}x_iy_i-\sum_{i = 1}^{n}x_i\sum_{i = 1}^{n}y_i}{n\sum_{i = 1}^{n}x_i^2-(\sum_{i = 1}^{n}x_i)^2}\) and \(b=\frac{\sum_{i = 1}^{n}y_i - m\sum_{i = 1}^{n}x_i}{n}\)
First, calculate the sums:
\(n = 8\)
\(\sum_{i = 1}^{8}x_i=30 + 36+44 + 51+60+68+75+82=446\)
\(\sum_{i = 1}^{8}y_i=45 + 43+36+35+30+27+23+17=256\)
\(\sum_{i = 1}^{8}x_iy_i=(30\times45)+(36\times43)+(44\times36)+(51\times35)+(60\times30)+(68\times27)+(75\times23)+(82\times17)\)
\(=1350+1548 + 1584+1785+1800+1836+1725+1394\)
\(=1350+1548=2898;2898 + 1584 = 4482;4482+1785 = 6267;6267+1800 = 8067;8067+1836 = 9903;9903+1725 = 11628;11628+1394 = 13022\)
\(\sum_{i = 1}^{8}x_i^2=30^2+36^2+44^2+51^2+60^2+68^2+75^2+82^2\)
\(=900 + 1296+1936+2601+3600+4624+5625+6724\)
\(=900+1296 = 2196;2196+1936 = 4132;4132+2601 = 6733;6733+3600 = 10333;10333+4624 = 14957;14957+5625 = 20582;20582+6724 = 27306\)
Now, calculate the slope \(m\):
\(m=\frac{8\times13022-446\times256}{8\times27306-(446)^2}\)
\(8\times13022 = 104176\); \(446\times256 = 446\times(250 + 6)=111500+2676 = 114176\)
\(8\times27306 = 218448\); \((446)^2=446\times446 = 198916\)
\(m=\frac{104176-114176}{218448 - 198916}=\frac{- 10000}{19532}\approx - 0.512\)
Calculate the y - intercept \(b\):
\(b=\frac{256-(-0.512)\times446}{8}=\frac{256 + 228.352}{8}=\frac{484.352}{8}\approx60.54\)
So the equation of the line of fit (using linear regression, which is a more accurate line of best fit) is approximately \(y=-0.51x + 60.54\)
Part c: Interpretation of Slope and y - intercept
- Slope: The slope of the line of fit represents the change in the number of cups of hot chocolate sold (\(y\)) for a one - degree change in temperature (\(x\)).
- y - intercept: The y - intercept represents the number of cups of hot chocolate sold when the temperature is \(0^{\circ}\)F (in the context of the model, although a temperature of \(0^{\circ}\)F may not be a practical value for this coffee shop's data range).
Interpretation:
- Slope: The slope \(m\approx - 0.51\) (from the linear regression line) means that for every \(1^{\circ}\)F increase in temperature, the number of cups of hot chocolate sold decreases by approximately \(0.51\) cups.
- y - intercept: The y - intercept \(b\approx60.54\) means that when the temperature is \(0^{\circ}\)F, the model predicts that approximately \(60.54\) cups of hot chocolate will be sold. However, since the temperature range in our data is from \(30^{\circ}\)F to \(82^{\circ}\)F, the y - intercept is an extrapolation beyond our data range and may not be a practical prediction for \(0^{\circ}\)F, but it is a part of the linear model.
Final Answers:
a. (Scatter plot: points plotted with \(x\) as temperature and \(y\) as cups, line of fit drawn through the trend of points)
b. Using linear regression, the equation is approximately \(y=-0.51x + 60.54\) (or a simpler approximate equation like \(y=-0.5x + 60\) based on visual fit)
c. Slope: For each \(1^{\circ}\)F increase in temperature, cups sold decrease by ~0.51. Y - intercept: At \(0^{\circ}\)F, ~60.54 cups sold (extrapolated).

Snap & solve any problem in the app
Get step-by-step solutions on Sovi AI
Photo-based solutions with guided steps
Explore more problems and detailed explanations
- Slope: The slope of the line of fit represents the change in the number of cups of hot chocolate sold (\(y\)) for a one - degree change in temperature (\(x\)).
- y - intercept: The y - intercept represents the number of cups of hot chocolate sold when the temperature is \(0^{\circ}\)F (in the context of the model, although a temperature of \(0^{\circ}\)F may not be a practical value for this coffee shop's data range).
Interpretation:
- Slope: The slope \(m\approx - 0.51\) (from the linear regression line) means that for every \(1^{\circ}\)F increase in temperature, the number of cups of hot chocolate sold decreases by approximately \(0.51\) cups.
- y - intercept: The y - intercept \(b\approx60.54\) means that when the temperature is \(0^{\circ}\)F, the model predicts that approximately \(60.54\) cups of hot chocolate will be sold. However, since the temperature range in our data is from \(30^{\circ}\)F to \(82^{\circ}\)F, the y - intercept is an extrapolation beyond our data range and may not be a practical prediction for \(0^{\circ}\)F, but it is a part of the linear model.
Final Answers:
a. (Scatter plot: points plotted with \(x\) as temperature and \(y\) as cups, line of fit drawn through the trend of points)
b. Using linear regression, the equation is approximately \(y=-0.51x + 60.54\) (or a simpler approximate equation like \(y=-0.5x + 60\) based on visual fit)
c. Slope: For each \(1^{\circ}\)F increase in temperature, cups sold decrease by ~0.51. Y - intercept: At \(0^{\circ}\)F, ~60.54 cups sold (extrapolated).