QUESTION IMAGE
Question
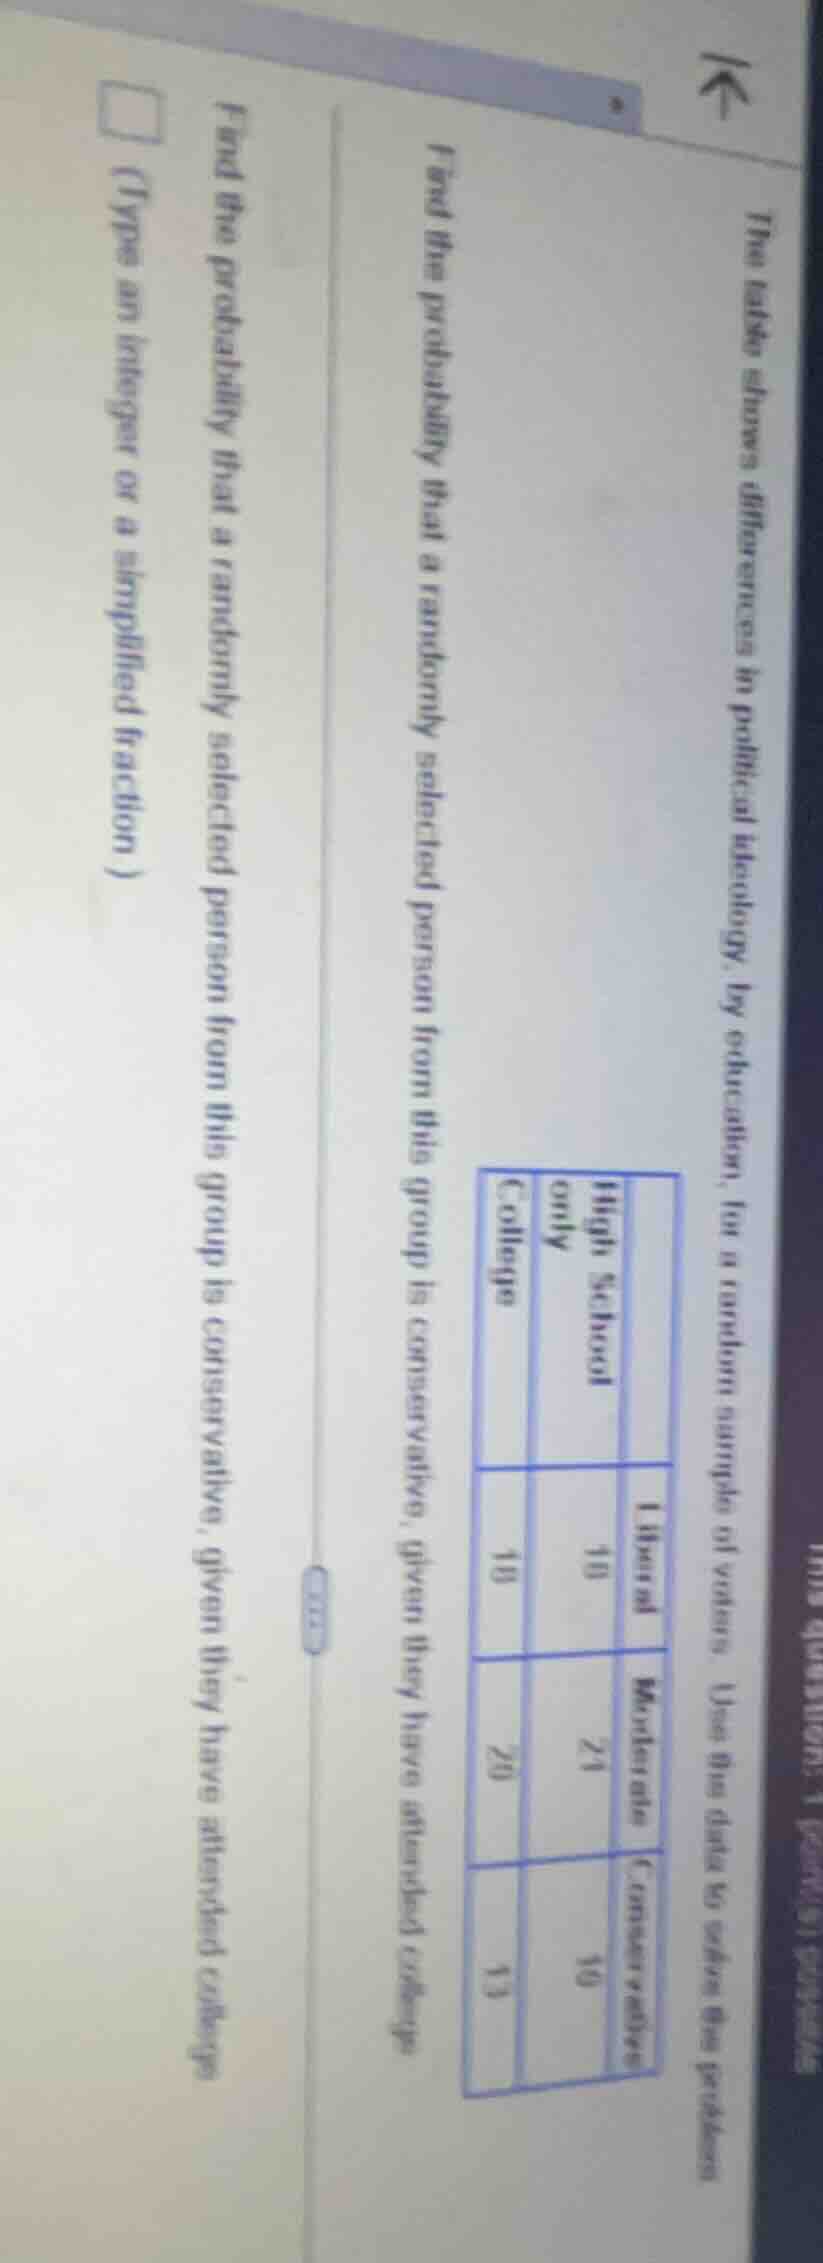
the table shows differences in political ideology, by education, in a random sample of voters. use the data to solve the problems. \
$$\begin{tabular}{|c|c|c|} \\hline & high school only & college \\\\ \\hline liberal & 10 & 18 \\\\ \\hline moderate & 24 & 20 \\\\ \\hline conservative & 10 & 13 \\\\ \\hline \\end{tabular}$$
\
- find the probability that a randomly selected person from this group is conservative, given they have attended college. \
- find the probability that a randomly selected person from this group is conservative, given they have attended college. \
(type an integer or a simplified fraction)
Step1: Identify college-attended totals
First, sum all voters who attended college:
$\text{Total College Voters} = 18 + 20 + 13 = 51$
Step2: Identify college conservative voters
Number of conservative college voters:
$\text{College Conservative} = 13$
Step3: Calculate conditional probability
Use conditional probability formula $P(A|B)=\frac{P(A\cap B)}{P(B)}$, here it is $\frac{\text{College Conservative}}{\text{Total College Voters}}$
$\text{Probability} = \frac{13}{51}$

Snap & solve any problem in the app
Get step-by-step solutions on Sovi AI
Photo-based solutions with guided steps
Explore more problems and detailed explanations
$\frac{13}{51}$