QUESTION IMAGE
Question
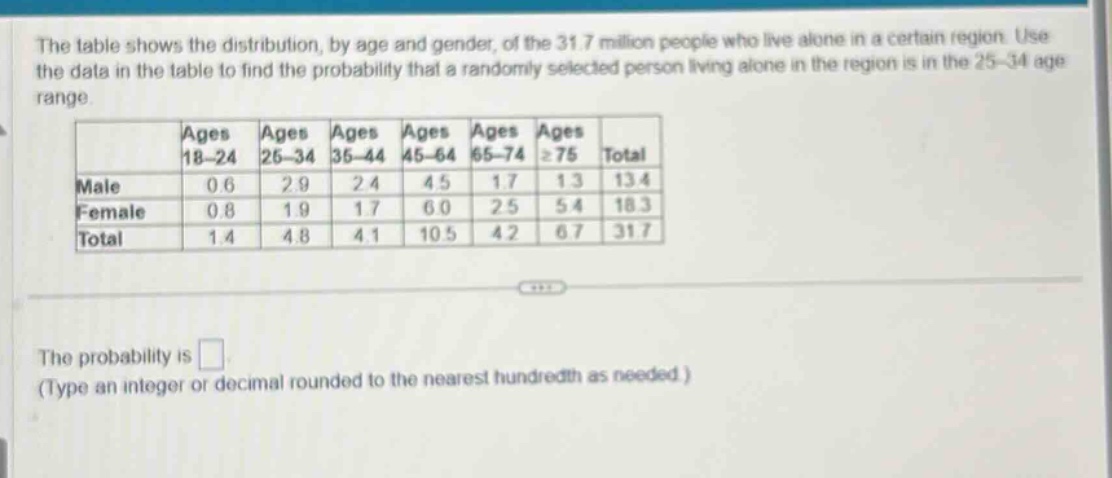
the table shows the distribution, by age and gender, of the 31.7 million people who live alone in a certain region. use the data in the table to find the probability that a randomly selected person living alone in the region is in the 25–34 age range. the probability is \\(\square\\). (type an integer or decimal rounded to the nearest hundredth as needed.)
Step1: Identify relevant values
From the table, the number of people in the 25 - 34 age range (total) is 4.8 million, and the total number of people living alone is 31.7 million.
Step2: Calculate probability
Probability is the number of favorable outcomes (people in 25 - 34 age range) divided by the total number of outcomes (total people living alone). So, the probability \( P=\frac{4.8}{31.7} \).
Step3: Compute the value
\( \frac{4.8}{31.7}\approx0.15 \) (rounded to the nearest hundredth).

Snap & solve any problem in the app
Get step-by-step solutions on Sovi AI
Photo-based solutions with guided steps
Explore more problems and detailed explanations
0.15