QUESTION IMAGE
Question
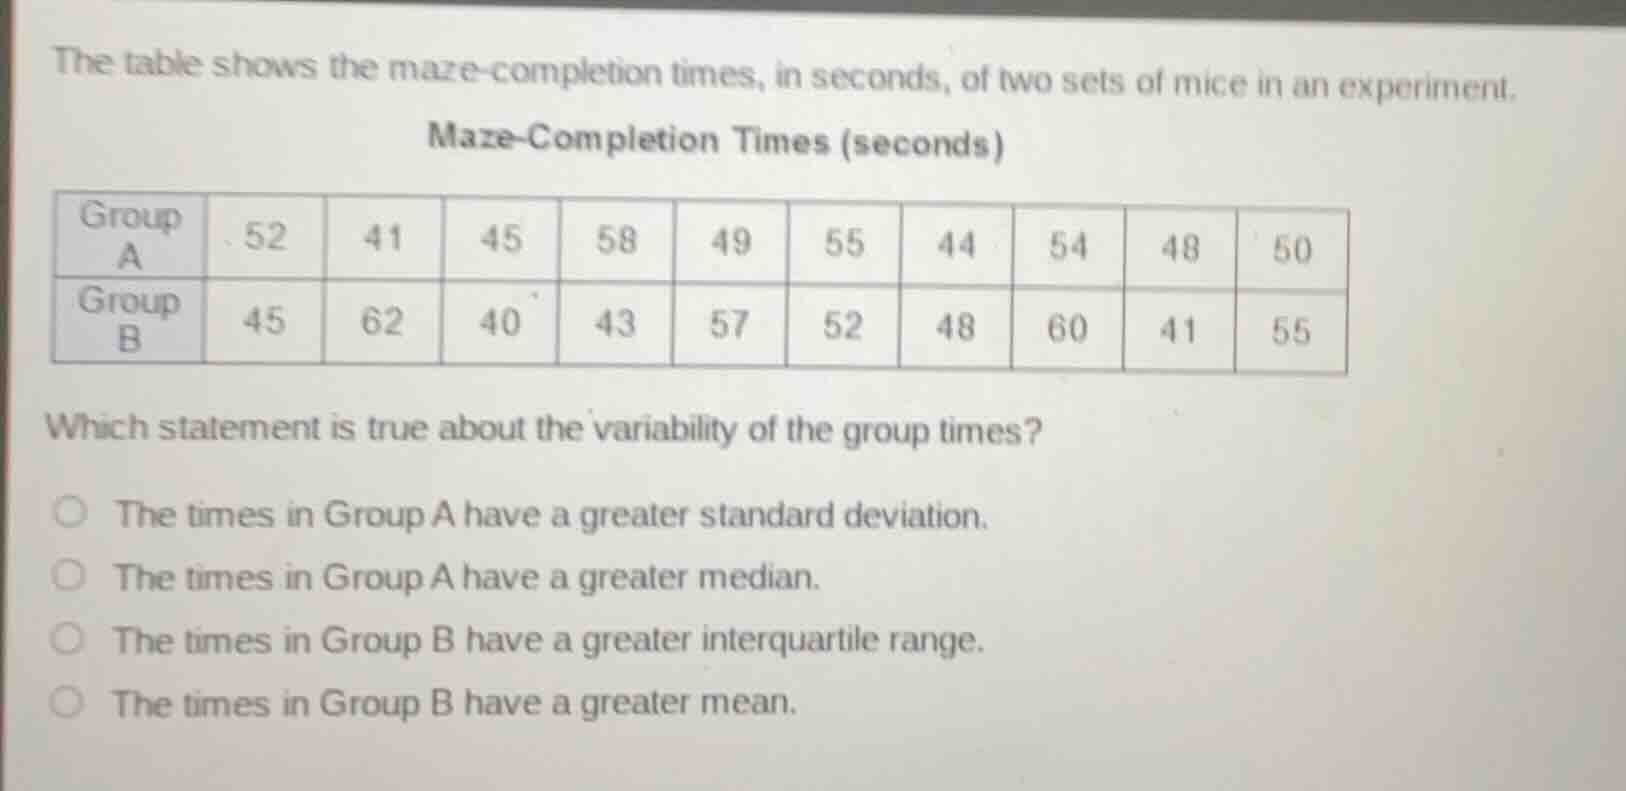
the table shows the maze - completion times, in seconds, of two sets of mice in an experiment.
maze - completion times (seconds)
| group a | 52 | 41 | 45 | 58 | 49 | 55 | 44 | 54 | 48 | 50 |
| group b | 45 | 62 | 40 | 43 | 57 | 52 | 48 | 60 | 41 | 55 |
which statement is true about the variability of the group times?
- the times in group a have a greater standard deviation.
- the times in group a have a greater median.
- the times in group b have a greater interquartile range.
- the times in group b have a greater mean.
Step1: Calculate Group A mean
$\bar{x}_A = \frac{52+41+45+58+49+55+44+54+48+50}{10} = \frac{496}{10} = 49.6$
Step2: Calculate Group B mean
$\bar{x}_B = \frac{45+62+40+43+57+52+48+60+41+55}{10} = \frac{503}{10} = 50.3$
Step3: Find Group A median
Sort Group A: $41, 44, 45, 48, 49, 50, 52, 54, 55, 58$
Median: $\frac{49+50}{2} = 49.5$
Step4: Find Group B median
Sort Group B: $40, 41, 43, 45, 48, 52, 55, 57, 60, 62$
Median: $\frac{48+52}{2} = 50$
Step5: Calculate Group A IQR
Q1 (Group A): $\frac{44+45}{2}=44.5$, Q3 (Group A): $\frac{54+55}{2}=54.5$
IQR_A = $54.5 - 44.5 = 10$
Step6: Calculate Group B IQR
Q1 (Group B): $\frac{41+43}{2}=42$, Q3 (Group B): $\frac{57+60}{2}=58.5$
IQR_B = $58.5 - 42 = 16.5$
Step7: Evaluate standard deviation (approx)
Group A data clusters closer to mean; Group B has more extreme values (60,62,40), so Group B has larger standard deviation.
Step8: Verify all options
- Option1: False (Group B has larger SD)
- Option2: False (Group B has larger median)
- Option3: True (IQR_B > IQR_A)
- Option4: False ($50.3 > 49.6$, but question asks about variability; this is central tendency, and even so, we check the variability-focused correct option)

Snap & solve any problem in the app
Get step-by-step solutions on Sovi AI
Photo-based solutions with guided steps
Explore more problems and detailed explanations
The times in Group B have a greater interquartile range.